Category Archives: Research Papers

Publication Of “Reply to “Comment On ‘Ocean Heat Content And Earth’s Radiation Imbalance. II. Relation To Climate Shifts’ ” by Nuccitelli Et Al. By Douglass and Knox 2012

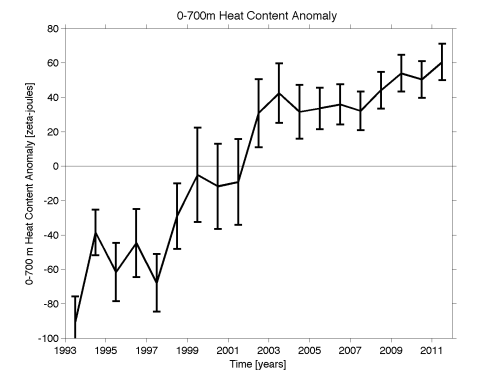
David Douglass alerted me to his reply to

Dana Nuccitelli, Robert Way, Rob Painting, John Church, John Cook: 2012: Comment on “Ocean heat content and Earth’s radiation imbalance. II. Relation to climate shifts” . Physics Letters A

in

D.H. Douglass, R.S. Knox, 2012: Reply to “Comment on ‘Ocean heat content and Earth’s radiation imbalance. II. Relation to climate shifts’ ” by Nuccitelli et al. Physics Letters A

The first and last paragraphs of his Reply summarize with

Nuccitelli, Way, Painting, Church and Cook [1] comment on our Letter “Ocean heat content and Earth’s radiation imbalance. II. Relation to climate shifts” [2]. Their criticism is unwarranted on at least three essential grounds. (1) It is based on a misunderstanding of the climate shift concept, which is central to our Letter; (2) in making its claim of incompleteness because of neglect of the deeper ocean heat content, it ignores our statement of possible error and introduces incompatible data; (3) it over-interprets our comments about CO2 forcing. We expand on these points.

In sum, we show that the criticism of our results (change of slope in the implied FTOA at the climate shift of 2001–2002) by Nuccitelli et al. is unwarranted because they used different data of less temporal resolution. A more careful analysis of this data shows, in fact, consistency and not conflict with our results.

I recommend reading the Douglass and Knox original article, and both the Comment and Reply. The original article is

D.H. Douglass, R.S. Knox, 2012: Ocean heat content and Earthʼs radiation imbalance. II. Relation to climate shifts. Physics Letters A, Volume 376, Issue 14, 5 March 2012, Pages 1226-1229

source of image

Comments Off on Publication Of “Reply to “Comment On ‘Ocean Heat Content And Earth’s Radiation Imbalance. II. Relation To Climate Shifts’ ” by Nuccitelli Et Al. By Douglass and Knox 2012

Filed under Climate Change Metrics, Research Papers

New Paper “Climatic Variability Over Time Scales Spanning Nine Orders of Magnitude: Connecting Milankovitch Cycles With Hurst–Kolmogorov Dynamics” By Markonis And Koutsoyiannis

There is another excellent paper that documents a larger magnitude of natural climate variation than has been assumed by the IPCC climate community [see also “The Climate Is Not What You Expect” By S. Lovejoy and D. Schertzer 2012 which I discussed in my post

Excellent New Paper “The Climate Is Not What You Expect” By Lovejoy and Schertzer 2012

This paper is

Yannis Markonis • Demetris Koutsoyiannis, 2012: Climatic Variability Over Time Scales Spanning Nine Orders of Magnitude: Connecting Milankovitch Cycles with Hurst–Kolmogorov Dynamics. Surv Geophy DOI 10.1007/s10712-012-9208-

The abstract reads [highlight added]

We overview studies of the natural variability of past climate, as seen from available proxy information, and its attribution to deterministic or stochastic controls. Furthermore, we characterize this variability over the widest possible range of scales that the available information allows, and we try to connect the deterministic Milankovitch cycles with the Hurst–Kolmogorov (HK) stochastic dynamics. To this aim, we analyse two instrumental series of global temperature and eight proxy series with varying lengths from 2 thousand to 500 million years. In our analysis, we use a simple tool, the climacogram, which is the logarithmic plot of standard deviation versus time scale, and its slope can be used to identify the presence of HK dynamics. By superimposing the climacograms of the different series, we obtain an impressive overview of the variability for time scales spanning almost nine orders of magnitude—from 1 month to 50 million years. An overall climacogram slope of -0.08 supports the presence of HK dynamics with Hurst coefficient of at least 0.92. The orbital forcing (Milankovitch cycles) is also evident in the combined climacogram at time scales between 10 and 100 thousand years. While orbital forcing favours predictability at the scales it acts, the overview of climate variability at all scales suggests a big picture of irregular change and uncertainty of Earth’s climate.

The conclusion includes the text

The available instrumental data of the last 160 years allow us to see that there occurred climatic fluctuations with a prevailing warming trend in the most recent past. However, when this period is examined in the light of the evidence provided by palaeoclimate reconstructions, it appears to be a part of more systematic fluctuations; specifically, it is a warming period after the 200-year ‘Little Ice Age’ cold period, during a 12,000-year interglacial, which is located in the third major icehouse period of the Phanerozoic Eon. The variability implied by these multi-scale fluctuations, typical for Earth’s climate, can be investigated by combining the empirical climacograms of different palaeoclimatic reconstructions of temperature. By superimposing the different climacograms, we obtain an impressive overview of the variability for time scales spanning almost nine orders of magnitude—from 1 month to 50 million years.

Two prominent features of this overview are (a) an overall climacogram slope of -0.08, supporting the presence of HK dynamics with Hurst coefficient of at least 0.92 and (b) strong evidence of the presence of orbital forcing (Milankovitch cycles) at time scales between 10 and 100 thousand years. While orbital forcing favours predictability at the scales it acts, the overview of climate variability at all scales clearly suggests a big picture of enhanced change and enhanced unpredictability of Earth’s climate, which could be also the cause of our difficulties to formulate a purely deterministic, solid orbital theory (either obliquity or precession dominated). Endeavours to describe the climatic variability in deterministic terms are equally misleading as those to describe it using classical statistics. Connecting deterministic controls, such as the Milankovitch cycles, with the Hurst–Kolmogorov stochastic dynamics seems to provide a promising path for understanding and modelling climate.

source of image

Comments Off on New Paper “Climatic Variability Over Time Scales Spanning Nine Orders of Magnitude: Connecting Milankovitch Cycles With Hurst–Kolmogorov Dynamics” By Markonis And Koutsoyiannis

Filed under Climate Change Forcings & Feedbacks, Research Papers

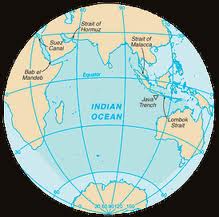
New Paper “Indian Ocean Warming Modulates Pacific Climate Change” By Luo Et Al 2012

Jing-Jia Luoa,Wataru Sasaki, and Yukio Masumoto, 2012: Indian Ocean warming modulates Pacific climate change. Published online before print October 29, 2012, doi: 10.1073/pnas.1210239109 PNAS October 29, 2012

The abstract reads [highlight added]

It has been widely believed that the tropical Pacific trade winds weakened in the last century and would further decrease under a warmer climate in the 21st century. Recent high-quality observations, however, suggest that the tropical Pacific winds have actually strengthened in the past two decades. Precise causes of the recent Pacific climate shift are uncertain. Here we explore how the enhanced tropical Indian Ocean warming in recent decades favors stronger trade winds in the western Pacific via the atmosphere and hence is likely to have contributed to the La Niña-like state (with enhanced east–west Walker circulation) through the Pacific ocean–atmosphere interactions. Further analysis, based on 163 climate model simulations with centennial historical and projected external radiative forcing, suggests that the Indian Ocean warming relative to the Pacific’s could play an important role in modulating the Pacific climate changes in the 20th and 21st centuries.

The conclusions include the text

“It is suggested that the multidecadal variability could be modulated or partly forced by anthropogenic radiative forcing, particularl the offset effects between GHGs and aerosol (31, 32). However, the signal-to-noise ratio (i.e., the ratio of the variance of multimodel ensemble mean to the variance of intermodel spreads) is small; this indicates uncertainties in attributing the multidecadal changes to external forcing. Besides, understanding exact mechanisms responsible for the multidecadal fluctuations and how global warming might modulate the multidecadal changes remains a challenge…..our results suggest that differences in the response to anthropogenic forcing over individual ocean basins, together with the interinfluence between the tropical IO and the Pacific, may affect not only the centennial trends but also multidecadal changes of the Pacific climate.”

This is yet another paper that highlights the complexity of the climate system and the difficulty skillful multi-decadal climate predictions and in seeking to attribute regional climate to particular climate forcings.

source of image

Comments Off on New Paper “Indian Ocean Warming Modulates Pacific Climate Change” By Luo Et Al 2012

Filed under Climate Change Forcings & Feedbacks, Climate Models, Research Papers

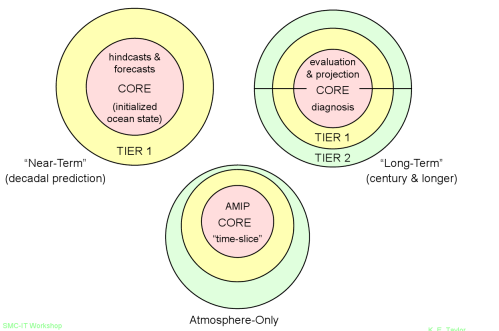
New Paper “Simulating Regime Structures In Weather And Climate Prediction Models” By Dawson Et Al 2012

Ryan Maue has alerted us to a new paper

Dawson A., T. N. Palmer and S. Corti: 2012: Simulating Regime Structures in Weather and Climate Prediction Models. Geophyscial Research Letters. doi:10.1029/2012GL053284 In press.

This paper further documents the gross inadequacies of the CMIP5 model runs as I have summarized, for example, in my posts

The Hindcast Skill Of The CMIP Ensembles For The Surface Air Temperature Trend” By Sakaguchi Et Al 2012

More CMIP5 Regional Model Shortcomings

CMIP5 Climate Model Runs – A Scientifically Flawed Approach

See also my post on a 2008 paper by Tim Palmer

Comments On The Article By Palmer et al. 2008 “Toward Seamless Prediction: Calibration of Climate Change Projections Using Seasonal Forecasts”

and my BAMS comment on his paper (and a related one by Jim Hurrell)

Pielke Sr., R.A., 2010: Comments on “A Unified Modeling Approach to Climate System Prediction”. Bull. Amer. Meteor. Soc., 91, 1699–1701, DOI:10.1175/2010BAMS2975.1,

The abstract of the Dawson et al 2012 GRL paper reads [highlight added]

It is shown that a global atmospheric model with horizontal resolution typical of that used in operational numerical weather prediction is able to simulate non-gaussian probability distributions associated with the climatology of quasi-persistent Euro-Atlantic weather regimes. The spatial patterns of these simulated regimes are remarkably accurate. By contrast, the same model, integrated at a resolution more typical of current climate models, shows no statistically significant evidence of such non-gaussian regime structures, and the spatial structure of the corresponding clusters are not accurate. Hence, whilst studies typically show incremental improvements in first and second moments of climatological distributions of the large-scale flow with increasing model resolution, here a real step change in the higher-order moments is found. It is argued that these results have profound implications for the ability of high resolution limited-area models, forced by low resolution global models, to simulate reliably, regional climate change signals.

Examples of key excerpts read

This paper presents a study of the ability of a state-of-the-art global atmospheric model, integrated in atmosphere-only mode at two different horizontal resolutions representative of NWP and climate models, to simulate Euro-Atlantic regime structures as found in reanalysis datasets. It is shown that whilst the NWP resolution model simulates the regimes well, the same model integrated at climate resolution has no statistically significant regimes at all.

This study supports the growing recognition that there is no more complex problem in computational science than that of simulating climate, and next generation climate simulators should be developed at current NWP resolutions – the need for Earth System complexity and ensemble capability notwithstanding.

We have shown that a low resolution atmospheric model, with horizontal resolution typical of CMIP5 models, is not capable of simulating the statistically significant regimes seen in reanalysis, yet a higher resolution configuration of the same model simulates regimes realistically. This result suggests that current projections of regional climate change may be questionable. This finding is also highly relevant to regional climate modelling studies where lower resolution global atmospheric models are often used as the driving model for high resolution regional models. If these lower resolution driving models do not have enough resolution to realistically simulate regimes, then then boundary conditions provided to the regional climate model could be systematically erroneous. It is therefore likely that the embedded regional model may represent an unrealistic realization of regional climate and variability.

This is a very convincing refutation of the claims in the Mears et al 2012 paper

Linda O. Mearns, Ray Arritt, Sébastien Biner, Melissa S. Bukovsky, Seth McGinnis, Stephan Sain, Daniel Caya, James Correia, Jr., Dave Flory, William Gutowski, Eugene S. Takle, Richard Jones, Ruby Leung, Wilfran Moufouma-Okia, Larry McDaniel, Ana M. B. Nunes, Yun Qian, John Roads, Lisa Sloan, Mark Snyder, 2012: The North American Regional Climate Change Assessment Program: Overview of Phase I Results. Bull. Amer.Met Soc. September issue. pp 1337-1362.

that I posted on in

Comment Submitted To BAMS On The Mearns Et Al 2012 Paper

Follow Up On My E-Mail Request To Linda Mearns Of NCAR

E-Mail To Linda Mearns On The 2012 BAMS Article On Dynamic Downscaling

“The North American Regional Climate Change Assessment Program: Overview of Phase I Results” By Mearns Et Al 2012 – An Excellent Study But It Overstates Its Significance In The Multi-Decadal Prediction Of Climate

As a final comment, the Dawson et al 2012 also confirms what I wrote in a paper in 1991

Pielke, R.A., 1991: Overlooked scientific issues in assessing hypothesized  greenhouse gas warming. Environ. Software, 6, 100-107.

It is the recommendation, as I wrote in that paper with the title

INABILITY FOR GCM MODELS TO PROPERLY RESOLVE THE EVOLUTION OF EXTRATROPICAL AND TROPICAL CYCLONES DUE TO THEIR POOR SPATIAL RESOLUTION

with the text

The horizontal grid spacing of general circulation models is around 400 km. As shown by Pielke (1984), as least four grid increments are required to reasonably represent an atmospheric feature, thus this grid resolution would only permit features 1600 km or larger to be reasonably represented in the models, Since extratropical cyclones often are observed to have horizontal wavelengths as small as 500 km or so, they are poorly represented in these models, Since these features provide the major physical mechanism for the exchange of heat, moisture, and momenlum between the subtropics and the polar regions, the inability of GCM representations to adequately represent these exchanges is a serious shortcoming. Tropical cyclones, which also provide an important mechanism for exchanges between the tropics and higher latitude is even more poorly represented since its scales of important physical processes includes the eye wall which can be tens of kilometers in radial size. Pielke (1988) discusses this shortcoming further.

Pielke, R.A., 1984: Mesoscale meteorological modeling. Academic Press, New York, N.Y., 612 pp.

Pielke, R.A., 1988: Evaluation of climate change using numerical models. In “Monitoring Climate for the Effects of Increasing Greenhouse Gas Concentrations. Proceedings of a Workshop”. R.A.
Pielke and T. Kittel, Eds., Cooperative Institute for Research in lhe Almosphere (CIRA),

source of image

Comments Off on New Paper “Simulating Regime Structures In Weather And Climate Prediction Models” By Dawson Et Al 2012

Filed under Climate Models, Research Papers

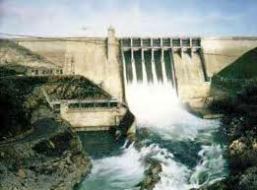
“Understanding The Impact Of Dam-Triggered Land Use/Land Cover Change On The Modification Of Extreme Precipitation” By Woldemichael Et Al 2012

We have a new paper accepted (in press) on the role of landscape processes on climate. It is

Woldemichael, A. T., F. Hossain, R. Pielke Sr., and A. Beltrán-Przekurat (2012), Understanding the impact of dam-triggered land use/land cover change on the modification of extreme precipitation, Water Resour. Res., 48, WXXXXX, doi:10.1029/2011WR011684.

The abstract reads [highlight added]

Two specific questions are addressed in this study regarding dams (artificial reservoirs). (1) Can a dam (artificial reservoir) and the land use/land cover (LULC) changes triggered by it physically alter extreme precipitation? The term extreme precipitation (EP) is used as a way of representing the model-derived upper bound of precipitation that pertains to the engineering definition of the standard probable maximum precipitation (PMP) used in design of dams. (2) Among the commonly experienced LULC changes due to dams, which type of change leads to the most detectable alteration of extreme precipitation? The American River Basin (ARW) and the Folsom dam were selected as a study region. Four scenarios of LULC change (comprising also various reservoir surface areas) were analyzed in a step by step fashion to elucidate the scenario leading to most significant impact on EP. The Regional Atmospheric Modeling System (RAMS, version 6.2) was used to analyze the impact of these LULC scenarios in two modes. In the first mode (called normal), the probable precipitation pattern due to each LULC scenario was identified. The second mode (called moisture-maximized), the PMP pattern represented from a 100% relative humidity profile was generated as an indicator of extreme precipitation (EP). For the particular case of ARW and Folsom dam, irrigation was found as having the most detectable impact on EP (a 5% increase in 72 h total for the normal mode and a 3% increase for the moisture-maximized mode) in and around the ARW watershed. Doubling the reservoir size, on the other hand, brought only a small change in EP. Our RAMS-simulated results demonstrate that LULC changes driven by dams can, in fact, alter the local to regional hydrometeorology as well as extreme precipitation. There is a strong possibility of a positive feedback mechanism initiated by irrigated landscapes located upwind of orographic rain producing watersheds that are impounded by large dams.

In the conclusions we wrote

The key goal of our study was to seek answers to two specific science questions: (1) Can a dam (artificial reservoir) and the land use/land cover (LULC) changes triggered by it physically contribute to the modification of extreme precipitation? (2) Among the commonly experienced LULC change due to dams, which type of change leads to the most detectable alteration of extreme precipitation? The answer to our first question is a “yes” while for the second question, we observed that for a dam in which the irrigated land is down- stream and upwind, the irrigation impact is much more superior from the two examined impacts in modifying the extreme precipitation patterns.

This is another in the continuing series of papers by ourselves and other colleagues that document the first-order climate forcing of land use/land cover change.

source of image

Comments Off on “Understanding The Impact Of Dam-Triggered Land Use/Land Cover Change On The Modification Of Extreme Precipitation” By Woldemichael Et Al 2012

Filed under Climate Change Forcings & Feedbacks, Research Papers

New Paper “Decision Scaling: Linking Bottom-Up Vulnerability Analysis With Climate Projections In The Water Sector” By Brown Et Al 2012

I was alerted to a new paper by Faisal Hossain that has adopted part of  the bottom-up perspective with respect that we hae proposed in our article

Pielke, R. A., Sr., R. Wilby,  D. Niyogi, F. Hossain, K. Dairuku,J. Adegoke, G. Kallos, T. Seastedt, and K. Suding (2012), Dealing with complexity and extreme events using a bottom-up, resource-based vulnerability perspective, in Extreme Events and Natural Hazards: The Complexity Perspective, Geophys. Monogr. Ser., vol. 196, edited by A. S. Sharma et al. 345–359, AGU, Washington, D. C., doi:10.1029/2011GM001086. [the article can also be obtained from here]

The new paper is

Brown, C., Y. Ghile, M. Laverty, and K. Li (2012), Decision scaling: Linking bottom-up vulnerability analysis with climate projections in the water sector, Water Resour. Res., 48, W09537, doi:10.1029/2011WR011212.

The abstract reads [highlight added]

There are few methodologies for the use of climate change projections in decision making or risk assessment processes. In this paper we present an approach for climate risk assessment that links bottom-up vulnerability assessment with multiple sources of climate information. The three step process begins with modeling of the decision and identification of thresholds. Through stochastic analysis and the creation of a climate response function, climate states associated with risk are specified. Climate information such as available from multi-GCM, multi run ensembles, is tailored to estimate probabilities associated with these climate states. The process is designed to maximize the utility of climate information in the decision process and to allow the use of many climate projections to produce best estimates of future climate risks. It couples the benefits of stochastic assessment of risks with the potential insight from climate projections. The method is an attempt to make the best use of uncertain but potentially useful climate information. An example application to an urban water supply system is presented to illustrate the process.

The article contains the statement with respect to the top-down global climate model predictions that

A problem with this approach is that GCM projections are relatively poor scenario generators.

I agree, and would add that they have provided NO demonstration of skillful regional and local predictions of changes in climate statistics from that in the historical and paleorecord.

The authors also write

“A novel aspect of the approach is that it uses decision analysis as a framework for characterizing the climate future, and consequently, climate projections, in terms of their position relative to decision thresholds. In doing so, it uses stochastic analysis for risk identification and uses GCM projections for risk estimation, assigning probabilities to hazards, thus linking the two methods.”
 but do, at least, recognize the need to move beyond just the GCM runs. They write
“Appropriately tailored climate information, including GCM projections and stochastically generated conditions from historical and paleodata, and the application of expert judgment, may provide informative answers to this question when approached in the manner described here.”

While the paper still seems to accept the robustness of the global climate model predictions, it does recognize that there are other approaches to accept climate risk.

The article, unfortunately, does not consider other environmental and social risks, relative to climate risks. In the Pielke et al 2012 paper we wrote

“We discuss the adoption of a bottom-up, resource–based vulnerability approach in evaluating the effect of climate and other environmental and societal threats to societally critical resources.This vulnerability concept requires the determination of the major threats to local and regional water, food, energy, human health, and ecosystem function resources from extreme events including climate, but also from other social and environmental issues. After these threats are identified for each resource, then the relative risks can be compared with other risks in order to adopt optimal preferred mitigation/adaptation strategies.

This is a more inclusive way of assessing risks, including from climate variability and climate change than using the outcome vulnerability approach adopted by the IPCC. A contextual vulnerability assessment, using the bottom-up, resource-based framework is a more inclusive approach for policymakers to adopt effective mitigation and adaptation methodologies to deal with the complexity of the spectrum of social and environmental extreme events that will occur in the coming decades, as the range of threats are assessed, beyond just the focus on CO2 and a few other greenhouse gases as emphasized in the IPCC assessments.”

Nonetheless, it is refreshing to see the much-needed start of a movement away from the top-down IPCC approach of assessing risks to key resources, which, as we have shown in our papers and in my weblog posts, is a fundamentally flawed approach.

I have sent the first author a copy of our 2012 paper and hope they will move to the complete adoption of the bottom-up, resource-based perspective.

source of image

Comments Off on New Paper “Decision Scaling: Linking Bottom-Up Vulnerability Analysis With Climate Projections In The Water Sector” By Brown Et Al 2012

Filed under Research Papers, Vulnerability Paradigm

New Article “Special Section On Climate Change And Water Resources: Climate Nonstationarity And Water Resources Management.” By Salas Et Al 2012

Jose (Pepe) Salas of Colorado State University has alerted us to an important new paper that he has authored. It is

Salas, J., Rajagopalan, B., Saito, L., and Brown, C. (2012). ”Special Section on Climate Change and Water Resources: Climate Nonstationarity and Water Resources Management.” J. Water Resour. Plann. Manage., 138(5), 385–388. doi: 10.1061/(ASCE)WR.1943-5452.0000279

The first paragraph of the article reads [highlight added]

Over the past three decades, hydrologists and water resources specialists have been concerned with the issue of nonstationarity arising from several factors. First is the effect of human intervention on the landscape that may cause changes in the precipitation–runoff relationships at various temporal and spatial scales. Second is the occurrence of natural events such as volcanic explosions or forest fires that may cause changes in the composition of the air, the soil surface, and geomorphology. Third is the low-frequency component of oceanic–atmospheric phenomena that may have significant effects on the variability of hydrological processes such as annual runoff, peak flows, and droughts. Fourth is global warming, which may cause changes to oceanic and atmospheric processes, thereby affecting the hydrological cycle at various temporal and spatial scales. There has been a significant amount of literature on the subject and thousands of research and project articles and books published in recent decades.

Among the informative text in the article, I was pleased to see their further confirmation of land use/land cover changes as a first-order climate forcing, when they wrote

Examples of human intrusion on the landscape are the changes in land use resulting from agricultural developments in semiarid and arid lands (e.g., Pielke et al. 2007, 2011), changes caused by large-scale deforestation (e.g., Gash and Nobre 1997), changes resulting from open-pit mining operations (e.g., Salas et al. 2008), and changes from increasing urbanization in watersheds (e.g., Konrad and Booth 2002,Villarini et al. 2009)…..Large-scale landscape changes such as deforestation in the tropical regions can potentially alter atmospheric circulation patterns, and consequently affect global weather and climate (e.g., Lee et al. 2008, 2009).

With respect to natural forcings and feedbacks, they write

Major natural events, such as the volcanic explosion of Mount St. Helens in 1980 or the El Chichon volcanic explosion of 1982 induce a shock to the climate system in the form of global cooling that continues for several years. These events can also affect global circulation. Low-frequency climate drivers of the oceanic– atmospheric system such as the El Niño/Southern Oscillation (ENSO), Pacific Decadal Oscillation (PDO), Atlantic Multidecadal Oscillation (AMO), and Arctic Oscillation (AO) modulate global climate at interannual and multidecadal time scales. These drivers are the main sources of nonstationarity in global climate and hydrology. Large numbers of papers documenting the effect of these drivers on global hydroclimatology continue to emerge (e.g., Dilley and Heyman 1995; Mantua et al. 1997; Enfield et al. 2001; Akintug and Rasmussen 2005; Hamlet et al. 2005).

With respect to “global warming“, they write

In addition to climate variability and change due to the previously mentioned factors, anthropogenic warming of the oceans and atmosphere because of increased greenhouse gas concentrations and the ensuing changes to the hydrologic cycle are topics of serious pursuit. The international scientific community is making strides in understanding the potential warming and its effects on all aspects of climate variability [Intergovernmental Panel on Climate Change (IPCC) 2007], but the impacts on the hydrologic cycle remain debatable and inconclusive (e.g., Cohn and Lins 2005; Legates et al. 2005; Hirsch and Ryberg 2011). Based on analyses of the global mean CO2 (GMCO2) and annual flood records in the United States, no strong statistical evidence for flood magnitudes increasing with GMCO2 increases were found (Hirsch and Ryberg 2011). Although general circulation models have had success in the attribution of warming global temperatures to anthropogenic causes, their credibility and utility in reproducing variables that are relevant to hydrology and water resources applications is less clear. For example, the IPCC Report for Latin America acknowledges that “the current GCMs do not produce projections of changes in the hydrological cycle at regional scales with confidence. In particular the uncertainty of projections of precipitation remain high….That is a great limiting factor to the practical use of such projections for guiding active adaptation or mitigation policies” (Magrin et al. 2007; Boulanger et al. 2007).

It is refreshing to see this broader perspective being adopted by the hydrology community.

source of image

Comments Off on New Article “Special Section On Climate Change And Water Resources: Climate Nonstationarity And Water Resources Management.” By Salas Et Al 2012

Filed under Climate Change Forcings & Feedbacks, Research Papers

New Paper “An Empirical Study Of The Impact Of Human Activity On Long-Term Temperature Change In China: A Perspective From Energy Consumption” By Li And Zhao 2012

Figure from Li and Zhao (2012) –  Spatial distribution of high, mid and low energy consumption region in China. Data for Tibet and Taiwan are absent. Green spot is the provincial capital cities of China.

Jos de Laat has alerted us to a new paper. It is

Li, Y. and X. Zhao (2012), An empirical study of the impact of human activity on long-term temperature change in China: A perspective from energy consumption, J. Geophys. Res., 117, D17117, doi:10.1029/2012JD018132.

The abstract reads [highlight added]

Human activity is an important contributor to local temperature change, especially in urban areas. Energy consumption is treated here as an index of the intensity of human induced local thermal forcing. The relationship between energy consumption and temperature change is analyzed in China by Observation Minus Reanalysis (OMR) method. Temperature trends for observation, reanalysis and OMR are estimated from meteorological records and 2 m-temperature from NCEP/NCAR Reanalysis 1 for the period 1979–2007. A spatial mapping scheme based on the spatial and temporal relationship between energy consumption and Gross Domestic Production (GDP) is developed to derive the spatial distribution of energy consumption of China in 2003. A positive relationship between energy consumption and OMR trends is found in high and mid energy consumption region. OMR trends decline with the decreasing intensity of human activity from 0.20°C/decade in high energy consumption region to 0.13°C/decade in mid energy consumption region. Forty-four stations in high energy consumption region that are exposed to the largest human impact are selected to investigate the impact of energy consumption spatial pattern on temperature change. Results show human impact on temperature trends is highly dependent on spatial pattern of energy consumption. OMR trends decline from energy consumption center to surrounding areas (0.26 to 0.04°C/decade) and get strengthened as the spatial extent of high energy consumption area expands (0.14 to 0.25°C/decade).

Excerpts from this paper include

Besides the impact of land use change on climate, the thermal impact induced by human activity within city plays significant role and should not be ignored. One of them is the anthropogenic heat released from energy consumption. Several studies have shown that anthropogenic heat is important to the development of UHI. Simulation results from a case study in Philadelphia suggested that anthropogenic heat contributes about 2~3C to the nighttime heat island in winter [Fan and Sailor, 2005].

The conclusion contains the text

Our results show significant warming has occurred for most stations in China and the magnitude of warming is closely related to energy consumption, which represents the intensity of human activity. For high and mid energy consumption group, OMR trends decline with the decrease of energy consumption. OMR trends for high and mid energy consumption group is 0.20 and 0.13C/decade respectively. Stronger warming is observed for station with high energy consumption, which usually locates in or near cities. Therefore, the strong warming is more likely a consequence of the local thermal forcing induced by human activity.

It seems that stations belong to high and mid energy consumption group in this study are affected
by human impact to a discernible extent. Just as De Laat[2008] demonstrated, anthropogenic heat released from energy consumption may very well have contributed to the observed temperature change patterns.Thus, it may raise more attention to consider the influence of human activity on surface temperature records in the past and next decades.

This study provides even more motivation for Anthony Watts to expand his station siting quality project to the entire globe!

Comments Off on New Paper “An Empirical Study Of The Impact Of Human Activity On Long-Term Temperature Change In China: A Perspective From Energy Consumption” By Li And Zhao 2012

Filed under Climate Change Metrics, Research Papers

E-Mail To Linda Mearns On The 2012 BAMS Article On Dynamic Downscaling

source of image from Linda Mearns website

With respect to my post

“The North American Regional Climate Change Assessment Program: Overview of Phase I Results” By Mearns Et Al 2012 – An Excellent Study But It Overstates Its Significance In The Multi-Decadal Prediction Of Climate

I have sent the lead author, Linda Mearns, the e-mail below [and copied to her other co-authors and to several other colleagues who work on downscaling]. I will post her reply, if I receive one and have her permission.

Subject: Your Septmeber 2012 BAMS

Hi Linda

I read with considerable interest your paper

Linda O. Mearns, Ray Arritt, Sébastien Biner, Melissa S. Bukovsky, Seth McGinnis, Stephan Sain, Daniel Caya, James Correia, Jr., Dave Flory, William Gutowski, Eugene S. Takle, Richard Jones, Ruby Leung, Wilfran Moufouma-Okia, Larry McDaniel, Ana M. B. Nunes, Yun Qian, John Roads, Lisa Sloan, Mark Snyder, 2012: The North American Regional Climate Change Assessment Program: Overview of Phase I Results. Bull. Amer.Met Soc. September issue. pp 1337-1362.

It is a very much needed, effective analysis of the level of regional dynamic downscaling skill when forced by reanalyses. In

Castro, C.L., R.A. Pielke Sr., and G. Leoncini, 2005: Dynamical downscaling: Assessment of value retained and added using the Regional Atmospheric Modeling System (RAMS). J. Geophys. Res. – Atmospheres, 110, No. D5, D05108, doi:10.1029/2004JD004721.

and summarized in

Pielke Sr., R.A., and R.L. Wilby, 2012: Regional climate downscaling . what’s the point? Eos Forum, 93, No. 5, 52-53, doi:10.1029/2012EO050008.

Pielke, R. A., Sr., R. Wilby,  D. Niyogi, F. Hossain, K. Dairuku,J. Adegoke, G. Kallos, T. Seastedt, and K. Suding (2012), Dealing with complexity and extreme events using a bottom-up, resource-based vulnerability perspective, in Extreme Events and Natural Hazards: The Complexity Perspective, Geophys. Monogr. Ser., vol. 196, edited by A. S. Sharma et al. 345.359, AGU, Washington, D. C., doi:10.1029/2011GM001086. [copy available from https://pielkeclimatesci.files.wordpress.com/2011/05/r-365.pdf]

you are evaluating the skill and value-added of Type 2 downscaling.

However, you are misleading the impacts communities by indicating that your results apply to regional climate change (i.e. Type 4 downscaling).

I have posted on my weblog today

“The North American Regional Climate Change Assessment Program: Overview of Phase I Results” By Mearns Et Al 2012 – An Excellent Study But It Overstates Its Significance In The Multi-Decadal Prediction Of Climate

which is critical of how you present the implications of your findings.

As you wrote at the end

The Mearns et al 2012 study concludes with the claim that

“Our goal was to provide an overview of the relative performances of the six models both individually and as an ensemble with regard to temperature and precipitation. We have shown that all the models can simulate aspects of climate well, implying that they all can provide useful information about climate change. In particular, the results from phase I of NARCCAP will be used to establish uncertainty due to boundary conditions as well as final weighting of the models for the development of regional probabilities of climate change.”

You write

“We have shown that all the models can simulate aspects of climate well, implying that they all can provide useful information about climate change.”

What you have actually accomplished (and it is significant) is document the upper bound in terms of simulation skill of value-added to reanalyses using dynamic downscaling. However, you have not shown how this study provides skillful information in terms of changes in regional climate statistics on multi-decadal time scales.

I would like to post on my weblog a response from you (and your co-authors if they would like to) that responds to my comments. I will also post this e-mail query.

I have also copied this e-mail to other of our colleagues who are working on dynamic downscaling.

With Best Regards

Roger

Comments Off on E-Mail To Linda Mearns On The 2012 BAMS Article On Dynamic Downscaling

Filed under Climate Models, Research Papers

“The North American Regional Climate Change Assessment Program: Overview of Phase I Results” By Mearns Et Al 2012 – An Excellent Study But It Overstates Its Significance In The Multi-Decadal Prediction Of Climate

There is a new paper

Linda O. Mearns, Ray Arritt, Sébastien Biner, Melissa S. Bukovsky, Seth McGinnis, Stephan Sain, Daniel Caya, James Correia, Jr., Dave Flory, William Gutowski, Eugene S. Takle, Richard Jones, Ruby Leung, Wilfran Moufouma-Okia, Larry McDaniel, Ana M. B. Nunes, Yun Qian, John Roads, Lisa Sloan, Mark Snyder, 2012: The North American Regional Climate Change Assessment Program: Overview of Phase I Results. Bull. Amer.Met Soc. September issue. pp 1337-1362.

that provides further documentation of the level of skill of dynamic downscaling. It is a very important new contribution which will be widely cited. The participants in the North American Regional Climate Change Assessment Program  are listed here.

However, it significantly overstates the significance of its findings in terms of its application to the multi-decadal prediction of regional climate.

The paper is even highlighted on the cover of the September 2012 issue of BAMS, with the caption for the cover in the Table of Contents that reads

“Regional models are the foundation of research and services as planning for climate change requires more specific information than can be provided by global models. The North American Regional Climate Change Assessment Programs (Mearns et al., page 1337) evaluates uncertainties in using such models….”

Actually, as outlined below, the Mearns et al 2012 paper, while providing valuable new insight into one type of regional dynamic downscaling, is misrepresenting what these models can skillfully provide with respect to “climate change”.

The study uses observational data (from a Reanalysis) to drive the regional models. Using the classification we have introduced in our papers (see below), this is a type 2 dynamic downscaling study.

The Mearns et al 2012 paper only provides an upper bound of what is possible with respect to their goal to provide

uncertainties in regional scale projections of future climate and produce high resolution climate change scenarios using multiple regional climate models (RCMs) nested within atmosphere ocean general circulation models (AOGCMs) forced with the A2 SRES scenario.”

The type of downscaling used in a study is a critically important point that needs to be emphasized when dynamic downscaling studies are presented.  Indeed, the new paper seeks to just replicate the current climate, NOT changes in climate statistics over the time period of the model runs.

It is even more challenging to skillfully predict CHANGES in regional climate which is what is required if the RCMs are to add any value for predicting climate in the coming decades.

The abstract and their short capsule reads [highlight added]

The North American Regional Climate Change Assessment Program is an international effort designed to investigate the uncertainties in regional scale projections of future climate and produce high resolution climate change scenarios using multiple regional climate models (RCMs) nested within atmosphere ocean general circulation models (AOGCMs) forced with the A2 SRES scenario, with a common domain covering the conterminous US, northern Mexico, and most of Canada. The program also includes an evaluation component (Phase I) wherein the participating RCMs, with a grid spacing 50 km, are nested within 25 years of NCEP/DOE global reanalysis II.

We provide an overview of our evaluations of the Phase I domain-wide simulations focusing on monthly and seasonal temperature and precipitation, as well as more detailed investigation of four sub-regions. We determine the overall quality of the simulations, comparing the model performances with each other as well as with other regional model evaluations over North America.  The metrics we use do differentiate among the models, but, as found in previous studies, it is not possible to determine a ‘best’ model among them. The ensemble average of the six models does not perform best for all measures, as has been reported in a number of global climate model studies. The subset ensemble of the 2 models using spectral nudging is more often successful for domain wide root mean square error (RMSE), especially for temperature. This evaluation phase of NARCCAP will inform later program elements concerning differentially weighting the models for use in producing robust regional probabilities of future climate change.

Capsule

This article presents overview results and comparisons with observations for temperature and precipitation from the six regional climate models used in NARCCAP driven by NCEP/DOE Reanalysis II (R2) boundary conditions for 1980 through 2004.

Using the types of dynamic downscaling that we present in the articles

Castro, C.L., R.A. Pielke Sr., and G. Leoncini, 2005: Dynamical downscaling:  Assessment of value retained and added using the Regional Atmospheric  Modeling System (RAMS). J. Geophys. Res. – Atmospheres, 110, No. D5, D05108,  doi:10.1029/2004JD004721.

Pielke Sr., R.A., and R.L. Wilby, 2012: Regional climate downscaling – what’s the point? Eos Forum,  93, No. 5, 52-53, doi:10.1029/2012EO050008.

the Mearns et al 2012 paper is a Type 2 downscaling. It provides an upper bound on the skill possible from Type 3 and Type 4 downscaling, since real world observations are used to constrain the model simulations (through the lateral boundary conditions, and from interior nudging if used).

These types of downscaling are defined in the Castro et al 2005 and Pielke and Wilby 2012 papers as

Type 1 downscaling is used for short-term, numerical weather prediction. In dynamic type 1 downscaling the regional model includes initial conditions from observations. In type 1 statistical downscaling the regression relationships are developed from observed data and the type 1 dynamic model predictions.

Type 2 dynamic downscaling refers to regional weather (or climate) simulations [e.g., Feser et al., 2011] in which the regional model’s initial atmospheric conditions are forgotten (i.e., the predictions do not depend on the specific initial conditions) but results still depend on the lateral boundary conditions from a global numerical weather prediction where initial observed atmospheric conditions are not yet forgotten or are from a global reanalysis. Type 2 statistical downscaling uses the regression relationships developed for type 1 statistical downscaling except that the input variables are from the type 2 weather (or climate) simulation. Downscaling from reanalysis products (type 2 downscaling) defines the maximum forecast skill that is achievable with type 3 and type 4 downscaling.

Type 3 dynamic downscaling takes lateral boundary conditions from a global model prediction forced by specified real world surface boundary conditions such as seasonal weather predictions based on observed sea surface temperatures, but the initial observed atmospheric conditions in the global model are forgotten [e.g., Castro et al., 2007]. Type 3 statistical downscaling uses the regression relationships developed for type 1 statistical downscaling except using the variables from the global model prediction forced by specified real-world surface boundary conditions.

Type 4 dynamic downscaling takes lateral boundary conditions from an Earth system model in which coupled interactions among the atmosphere, ocean, biosphere, and cryosphere are predicted [e.g., Solomon et al.,
2007]. Other than terrain, all other components of the climate system are calculated by the model except for human forcings, including greenhouse gas emissions scenarios, which are prescribed. Type 4 dynamic
downscaling is widely used to provide policy makers with impacts from climate decades into the future. Type 4 statistical downscaling uses transfer functions developed for the present climate, fed with large scale atmospheric information taken from Earth system models representing future climate conditions. It is assumed that statistical relationships between real-world surface observations and large-scale weather patterns will not change. Type 4 downscaling has practical value but with the very important caveat that it should be used for model sensitivity experiments and not as predictions [e.g., Pielke, 2002; Prudhomme et al., 2010].

Because real-world observational constraints diminish from type 1 to type 4 downscaling, uncertainty grows as more climate variables must be predicted by models, rather than obtained from observations.

The Mearns et al 2012 study concludes with the claim that

Our goal was to provide an overview of the relative performances of the six models both individually and as an ensemble with regard to temperature and precipitation. We have shown that all the models can simulate aspects of climate well, implying that they all can provide useful information about climate change. In particular, the results from phase I of NARCCAP will be used to establish uncertainty due to boundary conditions as well as final weighting of the models for the development of regional probabilities of climate change.

First, as documented in the article, the difference between  the models and the observations are actually significant. To claim that

“all the models can simulate aspects of climate well”

is not a robust claim.  What is meant by “well”?  The tables and figures in the article document significant biases in the temperatures and precipitation even for the current climate type 2 downscaling simulations.

Even more significantly, their type 2 downscaling study does NOT imply

“that they all can provide useful information about climate change”!

The  Mearns et al 2012 study did not look at the issue of their skill to predict CHANGES in climate statistics. For this they must examine type 4 downscaling skill, which they did not do.

In the context of the skill achieved with type 2 dynamic downscaling, this is an important, useful study.  However, to use the results of this type 2 downscaling study by Mearns et al 2012 to provide

“….final weighting of the models for the development of regional probabilities of climate change”

is a gross overstatement of what they accomplished. One cannot use type 2 downscaling to make claims about the accuracy of type 4 downscaling.

I am e-mailing the authors of the Mearns et al 2012 paper to request their response to my comments.  Each of them are well-respected colleagues and I will post their replies when they respond.

source of image

Comments Off on “The North American Regional Climate Change Assessment Program: Overview of Phase I Results” By Mearns Et Al 2012 – An Excellent Study But It Overstates Its Significance In The Multi-Decadal Prediction Of Climate

Filed under Climate Models, Climate Science Misconceptions, Research Papers