Category Archives: Research Papers

Our Chapter “Dealing with complexity and extreme events using a bottom-up, resource-based vulnerability perspective” By Pielke Sr Et Al 2012 Has Appeared

Our article

Pielke, R. A., Sr., R. Wilby,  D. Niyogi, F. Hossain, K. Dairuku,J. Adegoke, G. Kallos, T. Seastedt, and K. Suding (2012), Dealing with complexity and extreme events using a bottom-up, resource-based vulnerability perspective, in Extreme Events and Natural Hazards: The Complexity Perspective, Geophys. Monogr. Ser., vol. 196, edited by A. S. Sharma et al. 345–359, AGU, Washington, D. C., doi:10.1029/2011GM001086. [the article can also be obtained from here]

has appeared in

Sharma, A. S.,A. Bunde, P. Dimri, and D. N. Baker (Eds.) (2012), Extreme Events and Natural Hazards: The Complexity Perspective, Geophys. Monogr. Ser., vol. 196, 371 pp., AGU, Washington, D. C., doi:10.1029/GM196.

The description of the book is given on the AGU site as [highlight added]

Extreme Events and Natural Hazards: The Complexity Perspective examines recent developments in complexity science that provide a new approach to understanding extreme events. This understanding is critical to the development of strategies for the prediction of natural hazards and mitigation of their adverse consequences. The volume is a comprehensive collection of current developments in the understanding of extreme events. The following critical areas are highlighted: understanding extreme events, natural hazard prediction and development of mitigation strategies, recent developments in complexity science, global change and how it relates to extreme events, and policy sciences and perspective. With its overarching theme, Extreme Events and Natural Hazards will be of interest and relevance to scientists interested in nonlinear geophysics, natural hazards, atmospheric science, hydrology, oceanography, tectonics, and space weather.

The abstract of our article reads

“We discuss the adoption of a bottom-up, resource–based vulnerability approach in evaluating the effect of climate and other environmental and societal threats to societally critical resources.This vulnerability concept requires the determination of the major threats to local and regional water, food, energy, human health, and ecosystem function resources from extreme events including climate, but also from other social and environmental issues. After these threats are identified for each resource, then the relative risks can be compared with other risks in order to adopt optimal preferred mitigation/adaptation strategies.

This is a more inclusive way of assessing risks, including from climate variability and climate change than using the outcome vulnerability approach adopted by the IPCC. A contextual vulnerability assessment, using the bottom-up, resource-based framework is a more inclusive approach for policymakers to adopt effective mitigation and adaptation methodologies to deal with the complexity of the spectrum of social and environmental extreme events that will occur in the coming decades, as the range of threats are assessed, beyond just the focus on CO2 and a few other greenhouse gases as emphasized in the IPCC assessments.”

In the assessment of climate risks, the approach we recommend is an inversion of the IPCC process, where the threats from climate, and from other environmental and social risks are assessed first, before one inappropriately and inaccurately runs global climate models  to provide the envelope of future risks to key resources.

Comments Off on Our Chapter “Dealing with complexity and extreme events using a bottom-up, resource-based vulnerability perspective” By Pielke Sr Et Al 2012 Has Appeared

Filed under Research Papers, Vulnerability Paradigm

Review of Humlum Et Al 2012 “The Phase Relation Between Atmospheric Carbon Dioxide And Global Temperature” By Donald Rapp

Commentary By Donald Rapp on the paper: “The phase relation between atmospheric carbon dioxide and global temperature” by Ole Humlum, Kjell Stordahl, Jan-Erik Solheim, accepted for publication in: Global and Planetary Change.

This paper analyzed data on annual variations in carbon dioxide concentration, various measures of earth temperature, and rate of emissions of carbon dioxide for the period 1980 to 2011. They compared the rate of change of CO2 concentration with measures of the rate of change of global temperature. While both CO2 and temperature generally increased during this 31-year period, the rates of change varied significantly during the period. They showed that changes in CO2 correlated somewhat with changes in sea surface temperature (SST) but the CO2 change lagged the SST change by about 11-12 months. They concluded that “A main control on atmospheric CO2 appears to be the ocean surface temperature”. They mentioned possible connection to the giant 1998 El Niño but did not elaborate on the connection of the entire sequence of data to El Niño indices.

In the present posting I desire to make a few comments on this paper by Humlum et al. Of course, as noted by the authors, the common belief is that rising CO2 produces an increase in the rate of warming, not vice versa. Their data suggests quite the opposite.

Consider the figure at the top of this post.

The uppermost curve shows the NINO3.4 index from 1980 to 2011. Peak El Niños are labeled with letters A to F.

The middle curve shows the change in CO2 concentration per year plotted on a monthly basis. The peaks in this curve are also subjectively labeled A to F. The average change in CO2 concentration per year can be interpreted either as a ramp or a step-function. Arbitrarily adopting the step function, the average change in CO2 concentration per year varied from year to year about 1.5 ppm/yr prior to the 1998 El Niño, and varied from year to year about 2.0 ppm/yr after the 1998 El Niño. These are depicted as horizontal dashed lines x and y.

The lowermost curve shows the annual change in anthropogenic CO2 emissions plotted on a per month basis.

A rough rule of thumb is that each Gt of carbon (3.67 Gt of CO2) produces the equivalent of about 0.5 ppm of CO2 in the atmosphere if none of it is absorbed. The figure below shows that annual variations in global emissions of carbon are typically about 2 x 10⁴ metric tons per year which if unabsorbed, would produce annual changes in CO2 that are far too small to account for the observed variations in the average change in CO2 concentration per year.

The point made by Humlum et al. is that the average change in CO2 concentration per year lags the change in ocean temperature by about 11-12 months. As Tisdale showed in his book, El Niños leave behind them a pool of warm surface waters. As a result, the average change in CO2 concentration per year tends to lag the NINO3.4 index by a bit more than a year. This correlation is far from perfect but it seems to have some validity, particularly for the major El Niño that started toward the end of 1997. The data suggest that the ability of the oceans to absorb CO2 emitted by human activity responds to the state of the NINO3.4 index with a delay of a bit over a year.

Human activity is presently emitting roughly 8 Gt/yr of carbon, which if unabsorbed, would be sufficient to increase the atmospheric concentration of CO2 by about 4 ppm per year. Over a period of years, (very) roughly half of that CO2 is absorbed by earth systems (oceans, biosphere, …) and the other half ends in the atmosphere raising the atmospheric concentration by about 2 ppm. However, on a year-by-year basis, the proportion of emitted CO2 that is absorbed by the earth systems varies considerably, mainly due to the presence of warm surface waters in the Pacific produced quasi-periodically by El Niños. According to the graphical data below, the annual increase in CO2 concentration can be as high as 3 ppm (following the 1998 El Niño) or as low as 1 ppm (between peaks B and C). During the most recent period after the 1998 El Niño, variations in annual increase in CO2 concentration seem to have varied roughly as 2 ± 0.5 ppm or ±25%. These results seem to suggest that while roughly half of emissions end up in the atmosphere over an extended period, annual variations in the distribution of emitted CO2 between the atmosphere and the earth system are significant, and strongly dependent on prevalence of El Niños.

Tisdale showed that from 1976 to about 2005, there was a pronounced prevalence of El Niños over La Niñas. He argued that this could account for all of the warming of the earth during that period without invoking the greenhouse effect. However, it seems likely that during this period, a greater proportion of emitted CO2 ended up in the atmosphere due to prevalence of El Niños, and this might have amplified the natural El Niño warming effect via greenhouse gas forcing. McLean et al. (2009) estimated that 70% was due to El Niños while Foster et al. (2010) fell back on climate models that attribute only 15-30% of temperature variation in the 20th century to variability of the El Niño index. As is usual in climate matters, one has only to glance at the authors to know in advance what spin the results are likely to show. The Foster paper included the crème de la crème of climategate characters while the Mclean paper was written by skeptics.

The proportion of global heating from 1976 to 2005 due to prevalence of El Niños over La Niñas vs. greenhouse gas forcing remains uncertain. Nevertheless, the state of the Pacific Ocean is clearly important, not only for its impact on the atmospheric temperature, but also because it regulates the annual rise in CO2 concentration.

Tisdale, Bob (2012) “Who turned on the heat?”, http://bobtisdale.wordpress.com/

McLean, J. D., C. R. de Freitas, and R. M. Carter (2009) “Influence of the Southern Oscillation on tropospheric temperature” Journal of Geophysical Research, 114, D14104.

Foster, G., J. D. Annan, P. D. Jones, M. E. Mann, J. Renwick, J. Salinger, G. A. Schmidt and K. E. Trenberth (2010) “Comment on “Influence of the Southern Oscillation on tropospheric temperature” by J. D. McLean, C. R. de Freitas, and R. M. Carter”, Journal of Geophysical Research, 115, D09110.

Comments Off on Review of Humlum Et Al 2012 “The Phase Relation Between Atmospheric Carbon Dioxide And Global Temperature” By Donald Rapp

Filed under Guest Weblogs, Research Papers

New Paper “Observations Of Increased Tropical Rainfall Preceded By Air Passage Over Forests” By Spracklen Et al 2012

Chris Taylor has alerted us to another very important paper. It is

D. V. Spracklen, S. R. Arnold, C. M. Taylor, 2012: Observations of increased tropical rainfall preceded by air passage over forests, 2012:  NatureVolume:489,Pages:282–285 (13 September 2012)DOI:doi:10.1038/nature11390

 The abstract reads [highlight added]

Vegetation affects precipitation patterns by mediating moisture, energy and trace-gas fluxes between the surface and atmosphere1. When forests are replaced by pasture or crops, evapotranspiration of moisture from soil and vegetation is often diminished, leading to reduced atmospheric humidity and potentially suppressing precipitation2, 3. Climate models predict that large-scale tropical deforestation causes reduced regional precipitation4, 5, 6, 7, 8, 9, 10, although the magnitude of the effect is model9, 11 and resolution8 dependent. In contrast, observational studies have linked deforestation to increased precipitation locally12, 13, 14 but have been unable to explore the impact of large-scale deforestation. Here we use satellite remote-sensing data of tropical precipitation and vegetation, combined with simulated atmospheric transport patterns, to assess the pan-tropical effect of forests on tropical rainfall. We find that for more than 60 per cent of the tropical land surface (latitudes 30 degrees south to 30 degrees north), air that has passed over extensive vegetation in the preceding few days produces at least twice as much rain as air that has passed over little vegetation. We demonstrate that this empirical correlation is consistent with evapotranspiration maintaining atmospheric moisture in air that passes over extensive vegetation. We combine these empirical relationships with current trends of Amazonian deforestation to estimate reductions of 12 and 21 per cent in wet-season and dry-season precipitation respectively across the Amazon basin by 2050, due to less-efficient moisture recycling. Our observation-based results complement similar estimates from climate models4, 5, 6, 7, 8, 9, 10, in which the physical mechanisms and feedbacks at work could be explored in more detail.

In their conclusuions, they write

Our analysis explores the role of regional-scale vegetation patterns on precipitation. Through evapotranspiration, forests maintain atmospheric moisture that can return to land as rainfall downwind. These processes operate on timescales of days over distances of 100–1,000km such that large-scale land-use change may alter precipitation hundreds to thousands of kilometres from the region of vegetation change. Land-use patterns and small-scale deforestation may also alter precipitation locally, through changes in the thermodynamic profile and the development of surface-induced mesoscale circulations. Natural and pyrogenic emissions from vegetation can also have a role in rainfall initiation over tropical forest regions. The impact of cloud microphysical processes on precipitation is highly uncertain, and biogenic emissions could contribute to our observed relationship between rainfall and exposed vegetation. However, our water-balance calculations imply that cumulative increases in evapotranspiration over upstream forested regions more than account for the increase in downstream rainfall.

What this paper means is that the atmosphere is enriched by water vapor and convective potential energy as it is transported across a region of transpiring vegetation. The removal of this vegetation results in an atmosphere that is less conducive to precipitation.  While the paper focuses on the effects of tropical deforestation, this would be expected to occur in locations where increases in transpiration occur such as due to irrigation. Several of our papers that have examined this issue include

Hossain, F., I. Jeyachandran, and R.A. Pielke Sr., 2010: Dam safety effects due to human alteration  of extreme precipitation. Water Resources Research, 46, W03301,   doi:10.1029/2009WR007704.

Degu, A. M., F. Hossain, D. Niyogi, R. Pielke Sr., J. M.   Shepherd, N. Voisin, and T. Chronis, 2011: The influence of large dams on surrounding climate and   precipitation patterns. Geophys. Res. Lett., 38, L04405, doi:10.1029/2010GL046482.

Woldemichael, A., F. Hossain,   R.A. Pielke Sr., and A. Beltrán-Przekurat, 2012: Understanding the impact of dam-triggered land use/land cover change on the modification of extreme precipitation, Water Resour. Res., doi:10. 1029/ 2011 WR011684.

Pielke, R.A. and X. Zeng, 1989: Influence on severe storm development  of irrigated land. Natl. Wea. Dig., 14, 16-17.

Pielke Sr., R.A., 2001: Influence of the spatial distribution of vegetation  and soils on the prediction of cumulus convective rainfall. Rev. Geophys.,  39, 151-177.

In Figure 9 in Pielke et al 2001, for example, we show the major impact on the potential for deep cumulonimbus clouds (and thus rainfall) of just an increasre in surface air dew point temperature by just one degree Celcius.

The new Sracklen et al 2012 is yet another example of why land use/land cover change is a first order human climate forcing.

source of image

Comments Off on New Paper “Observations Of Increased Tropical Rainfall Preceded By Air Passage Over Forests” By Spracklen Et al 2012

Filed under Climate Change Forcings & Feedbacks, Research Papers

The Hindcast Skill Of The CMIP Ensembles For The Surface Air Temperature Trend” By Sakaguchi Et Al 2012

Figure caption: These maps show the observed (left) and model-predicted (right) air temperature trend from 1970 to 1999. The climate model developed by the National Center for Atmospheric Research (NCAR) is used here as an example. More than 50 such simulations were analyzed in the published study. (Illustration: Koichi Sakaguchi)

I was alerted to a new paper that examines the predictive skill of the multi-decadal global climate predictions; h/t to Anthony Watts in his post

Climate Models shown to be inaccurate less than 30 years out

Actually, the article also informs us on their value for even longer time periods,. The article is

Sakaguchi, K., X. Zeng, and M. A. Brunke (2012), The hindcast skill of the CMIP ensembles for the surface air temperature trend, J. Geophys. Res., 117, D16113, doi:10.1029/2012JD017765.

[as a side comment, Xubin Zeng was one of my Ph.d. students (and an outstanding one!) who I have published with, and I have also published with Mike Brunke].

The abstract reads [highlight added]

Linear trends of the surface air temperature (SAT) simulated by selected models from the Coupled Model Intercomparison Project (CMIP3 and CMIP5) historical experiments are evaluated using observations to document (1) the expected range and characteristics of the errors in hindcasting the ‘change’ in SAT at different spatiotemporal scales, (2) if there are ‘threshold’ spatiotemporal scales across which the models show substantially improved performance, and (3) how they differ between CMIP3 and CMIP5. Root Mean Square Error, linear correlation, and Brier score show better agreement with the observations as spatiotemporal scale increases but the skill for the regional (5° × 5° – 20° × 20° grid) and decadal (10 – ∼30-year trends) scales is rather limited. Rapid improvements are seen across 30° × 30° grid to zonal average and around 30 years, although they depend on the performance statistics. Rather abrupt change in the performance from 30° × 30° grid to zonal average implies that averaging out longitudinal features, such as land-ocean contrast, might significantly improve the reliability of the simulated SAT trend. The mean bias and ensemble spread relative to the observed variability, which are crucial to the reliability of the ensemble distribution, are not necessarily improved with increasing scales and may impact probabilistic predictions more at longer temporal scales. No significant differences are found in the performance of CMIP3 and CMIP5 at the large spatiotemporal scales, but at smaller scales the CMIP5 ensemble often shows better correlation and Brier score, indicating improvements in the CMIP5 on the temporal dynamics of SAT at regional and decadal scales.

The conclusions contain the informative caution

The spatiotemporal scales with more reliable model skills as identified in this study are consistent with previous studies [Randall et al., 2007] and suggest caution in directly using the outputs of long-term simulations for regional and decadal studies.

This is reminensent of the statement by Kevin Trenberth who wrote for Nature entitled

Predictions of climate

that

“…..we do not have reliable or regional predictions of climate.”

Clearly, the CMIP5 model results do not have the skill needed by the impacts communities either directly from the global model or dynamically or statistically downscaled on any multi-decadal time scales, as we summarized in our article

Pielke Sr., R.A., and R.L. Wilby, 2012: Regional climate downscaling – what’s the point? Eos Forum,  93, No. 5, 52-53, doi:10.1029/2012EO050008.

If they do not have sufficient skill for time periods less than 30 years for surface temperature, and longer time periods are made up of 30 years periods, they certainly will not have added skill at any multi-decadal time period. Moreover, since other climate metrics (e.g. precipitation) are even more difficult to predict, the lack of value of the CMIP5 model runs for the impacts communities is actually well (although subtlely) documented in the Sakaguchi et al 2o12 paper.

There is a major oversight, however, in the Sakaguchi et al 2o12 paper. This paper neglected to include available peer reviewed papers that document a serious lack of skill in the CMIP5 model runs. I have summarized these in my posts

Comments On The Nature Article “Afternoon Rain More Likely Over Drier Soils” By Taylor Et Al 2012 – More Rocking Of The IPCC Boat

More CMIP5 Regional Model Shortcomings

CMIP5 Climate Model Runs – A Scientifically Flawed Approach

By neglecting the peer reviewed papers I listed in those posts [most of which available to the authors], the Sakaguchi et al 2o12 even with its critical assessment of the CMIP3 and CMIP5 model predictive skill, has still not completely assessed the actual skill of the CMIP5 and CMIP3 model capabilities.

Comments Off on The Hindcast Skill Of The CMIP Ensembles For The Surface Air Temperature Trend” By Sakaguchi Et Al 2012

Filed under Climate Models, Research Papers

Comments On The Nature Article “Afternoon Rain More Likely Over Drier Soils” By Taylor Et Al 2012 – More Rocking Of The IPCC Boat

I have posted on the documented (in peer reviewed papers) gross inadequacies of the global climate models to provide skillful predictions in a hindcast mode; e.g.. see

More CMIP5 Regional Model Shortcomings

CMIP5 Climate Model Runs – A Scientifically Flawed Approach

I have been alerted to yet another study that documents this shortcoming [h/t Marcel Crok]. The final sentence of this study has the blunt comment regarding climate model skill that

“….the erroneous sensitivity of convection schemes demonstrated here is likely to contribute to a tendency for large-scale models to `lock-in’ dry conditions, extending droughts unrealistically, and potentially exaggerating the role of soil moisture feedbacks in the climate system.”

This new paper is

Taylor et al, 2012: Afternoon rain more likely over drier soils. Nature. doi:10.1038/nature11377. Received 19 March 2012 Accepted 29 June 2012 Published online 12 September 2012

[as a side note, I published with the senior author in the paper Taylor, C.M., R.J. Harding, R.A. Pielke, Sr., P.L. Vidale, R.L. Walko,  and J.W. Pomeroy, 1998: Snow breezes in the boreal forest. J. Geophys.  Res., 103, 23087-23101.]

The abstract reads [highlight added]

Land surface properties, such as vegetation cover and soil moisture, influence the partitioning of radiative energy between latent and sensible heat fluxes in daytime hours.During dry periods, soil-water deficit can limit evapotranspiration, leading to warmer and drier conditions in the lower atmosphere. Soil moisture can influence the development of convective storms through such modifications of low-level atmospheric temperature and humidity, which in turn feeds back on soil moisture. Yet there is considerable uncertainty in how soil moisture affects convective storms across the world, owing to a lack of observational evidence and uncertainty in large-scale models. Here we present a global-scale observational analysis of the coupling between soil moisture and precipitation. We show that across all six continents studied, afternoon rain falls preferentially over soils that are relatively dry compared to the surrounding area. The signal emerges most clearly in the observations over semi-arid regions, where surface fluxes are sensitive to soil moisture, and convective events are frequent. Mechanistically, our results are consistent with enhanced afternoon moist convection driven by increased sensible heat flux over drier soils, and/or mesoscale variability in soil moisture. We find no evidence in our analysis of a positive feedback—that is, a preference for rain over wetter soils—at the spatial scale (50–100 kilometres) studied. In contrast, we find that a positive feedback of soil moisture on simulated precipitation does dominate in six state-of-the-art global weather and climate models— a difference that may contribute to excessive simulated droughts in large-scale models.

The conclusions include the text

Finally, we repeat our analysis using 3-hourly diagnostics from six global models, ranging in horizontal resolution from 0.5 to 2.0 (degrees). Our results (Fig. 3) indicate a strong preference for rain over wet soils for large parts of the world, in contrast to the observations. Only one model (Fig. 3e) produces more than the expected 10% of grid cells with P<10, largely due to contributions at mid-latitudes. The crossmodel signal favouring precipitation over wet soil, particularly across the tropics (Supplementary Table 3), demonstrates a fundamental failing in the ability of convective parameterizations to represent land feedbacks on daytime precipitation. This is likely to be linked to the oft-reported phase lag in the diurnal cycle of precipitation; that is, simulated rainfall tends to start several hours too early, and is possibly amplified by a lack of boundary-layer clouds in some models. This weakness has been related to the crude criteria used to trigger deep convection in large-scale models. The onset of convective precipitation is overly sensitive to the daytime increase of moist convective instability, which is typically faster over wetter soils3, favouring a positive feedback. Early initiation limits the effect of other daytime processes on triggering convection in the models. In contrast, our observational analysis points to the importance of dry boundary-layer dynamics for this phenomenon over land.

The observed preference for afternoon rain over locally drier soil on scales of 50–100 km is consistent with a number of regional studies based on remotely sensed data. Our failure to find areas of positive feedback may indicate the importance of surface-induced mesoscale flows in triggering convection, although the coarse spatial resolution of our data sets prevents us from drawing firm conclusions on this issue. Equally, mixing processes in the growth stage of convective clouds before precipitation, may play an important role. Neither of these processes is captured in existing one-dimensional analyses. Furthermore, our results raise questions about the ability of models reliant on convective parameterizations to represent these processes adequately. Although the coarser-resolution models analysed here (HadGEM2, CNRM-CM5 and INMCM4) cannot resolve mesoscale soil moisture structures, nor their potential impacts on convective triggering, all the models have a strong tendency towards rain over wetter soils, for which we find no observational support. Our study does not, however, imply that the soil moisture feedback is negative at temporal and spatial scales different from those analysed here. The multi-day accumulation of moisture in the lower atmosphere from a freely transpiring land surface may provide more favourable initial (dawn) conditions for daytime convection than the equivalent accumulation over a drought-affected region. Equally, the large-scale dynamical response to soil moisture may dominate in some regions. However, the erroneous sensitivity of convection schemes demonstrated here is likely to contribute to a tendency for large-scale models to `lock-in’ dry conditions, extending droughts unrealistically, and potentially exaggerating the role of soil moisture feedbacks in the climate system.

We have also looked at this issue, for example, in our paper

Pielke Sr., R.A., 2001: Influence of the spatial distribution of vegetation  and soils on the prediction of cumulus convective rainfall. Rev. Geophys.,  39, 151-177

where we reported that

Wetzel et al. [1996], in a study in the Oklahoma area, found that cumulus clouds form first over hotter, more sparsely vegetated areas. Over areas covered with deciduous forest, clouds were observed to form 1–2 hours later due to the suppression of vertical mixing. Rabin et al. [1990] also found from satellite images that cumulus clouds form earliest over regions of large sensible heat flux and are suppressed over regions with large latent heat flux during relatively dry atmospheric conditions.

While we also reported that

Clark and Arritt [1995], however, found while the cumulus cloud precipitation was delayed when the soil moisture was higher, the total accumulation of precipitation was greater. The largest rainfall was generally predicted to occur for moist, fully vegetated surfaces…..De Ridder [1998] found that dense vegetation produces a positive feedback to precipitation.

This indicates, however, that if the delay is long enough during the day over moist soils and/or transpiring vegetation, cumulus rainfall will not ever be able to develop.

The take-home message from the Taylor et al 2012 paper is yet another demonstration of the failure of the climate models as a tool to skillfully simulate the climate system. Their use by the IPCC and others to predict droughts decades from now for the impacts communties is misleading and erroneous abuse of the current state of climate science. 

source of image

Comments Off on Comments On The Nature Article “Afternoon Rain More Likely Over Drier Soils” By Taylor Et Al 2012 – More Rocking Of The IPCC Boat

Filed under Climate Change Forcings & Feedbacks, Research Papers

New Paper “Climate Feedback–Based Provisions For Dam Design, Operations, And Water Management In The 21st Century” By Hossain Et Al 2012

We have a new paper under the leadership of Fasial Hossain of the  Department of Civil and Environmental Engineering at Tennessee Technological University,

Hossain, F., A.M. Degu, W. Yigzaw, S.J. Burian, D. Niyogi, J.M. Shepherd and R.A. Pielke Sr., 2012: Climate feedback–based provisions for dam design, operations, and water management in the 21st Century. J. Hydro. Eng., DOI: DOI: 10.1061/(ASCE)HE.1943-5584.0000541, in press.

The conclusion reads in part [highlight added]

The purpose of this article is to shed light on the need for climate feedback-based considerations in dam design, operations, and water management for the 21st century. It first overviewed the known impacts on climate from changes in land use and land cover that are typically anticipated once a dam is constructed. Recent research was presented on the first-order signature around dams on local climate using observational evidence. A global overview of the location of large dams was presented to highlight the need to treat each dam uniquely according to its location and the larger setting. It is now obvious that the observational data associated with current dams, combined with the rich body of research of LCLU impact on climate, can provide the planning and engineering professions with insightful guidance for both operations and more robust dam-building in the 21st century as well as modifications of local design guidelines to account for climate feedback.

The conclusion includes the recommendation that

One way to maximize the ability of future generation of engineers to assimilate knowledge on climate modification for dam design and operations is to enhance the baccalaureate curriculum by adding prerequisite courses on atmospheric sciences and climate.

In this context, we do not mean climate education that starts from the incorrect premise that the human addition of CO2 and a few other greenhouse gases dominate the climate system response in the coming decades. We subscribe to the robust view of the climate system as reported in the 2005 NRC assessment report

National Research Council, 2005: Radiative forcing of climate change: Expanding the concept and addressing uncertainties. Committee on Radiative Forcing Effects on Climate Change, Climate Research Committee, Board on Atmospheric Sciences and Climate, Division on Earth and Life Studies, The National Academies Press, Washington, D.C., 208 pp.

and summarized in

Pielke Sr., R., K.  Beven, G. Brasseur, J. Calvert, M. Chahine, R. Dickerson, D.  Entekhabi, E. Foufoula-Georgiou, H. Gupta, V. Gupta, W. Krajewski, E.  Philip Krider, W. K.M. Lau, J. McDonnell,  W. Rossow,  J. Schaake, J.  Smith, S. Sorooshian,  and E. Wood, 2009: Climate change: The need to consider human forcings besides greenhouse gases.   Eos, Vol. 90, No. 45, 10 November 2009, 413. Copyright (2009) American   Geophysical Union.

source of image

Comments Off on New Paper “Climate Feedback–Based Provisions For Dam Design, Operations, And Water Management In The 21st Century” By Hossain Et Al 2012

Filed under Research Papers, Vulnerability Paradigm

More CMIP5 Regional Model Shortcomings

source of image

In my post

CMIP5 Climate Model Runs – A Scientifically Flawed Approach

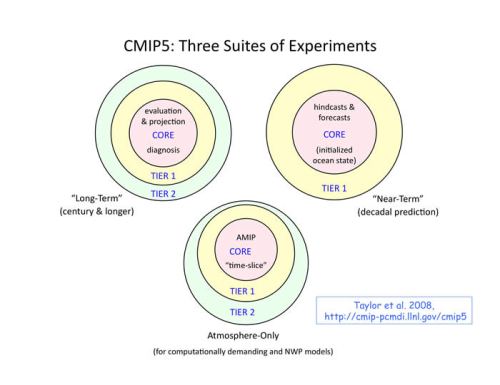
The CMIP5 – Coupled Model Intercomparison Project Phase 5 is an integral part of the upcoming IPCC assessment.  Two of its goals are to

  • evaluate how realistic the models are in simulating the recent past,
  • provide projections of future climate change on two time scales, near term (out to about 2035) and long term (out to 2100 and beyond)

In my post, CMIP5 Climate Model Runs – A Scientifically Flawed Approach, I presented a number of peer-reviewed model comparisons with real world observations that documents the failure of the multi-decadal global climate models to provide skillful regional climate predictions to the impacts communities.

I concluded my post with the text

These studies, and I am certain more will follow, show that the multi-decadal climate models are not even skillfully simulating current climate statistics, as are needed by the impacts communities, much less CHANGES in climate statistics.  At some point, this waste of money to make regional climate predictions decades from now is going to be widely recognized.

Jos de Laat of KNMI has provided us with further examples that document the serious limitation of the CMIP5 model results. I have presented this list below [with highlighting]. I am pleased that the model hindcast predictions are being reported, as this is clearly information that the impact and policy communities need.

L. Goddard, A. Kumar, A. Solomon, D. Smith, G. Boer, P. Gonzalez, V. Kharin, W. Merryfield, C. Deser, S. J. Mason, B. P. Kirtman, R. Msadek, R. Sutton, E. Hawkins, T. Fricker, G. Hegerl, C. A. T. Ferro, D. B. Stephenson, G. A. Meehl, T. Stockdale, R. Burgman, A. M. Greene, Y. Kushnir, M. Newman, J. Carton, I. Fukumori, T. Delworth. (2012) A verification framework for interannual-to-decadal predictions experiments. Climate Dynamics Online publication date: 24-Aug-2012.

Abstract

Decadal predictions have a high profile in the climate science community and beyond, yet very little is known about their skill. Nor is there any agreed protocol for estimating their skill. This paper proposes a sound and coordinated framework for verification of decadal hindcast experiments. The framework is illustrated for decadal hindcasts tailored to meet the requirements and specifications of CMIP5 (Coupled Model Intercomparison Project phase 5). The chosen metrics address key questions about the information content in initialized decadal hindcasts. These questions are: (1) Do the initial conditions in the hindcasts lead to more accurate predictions of the climate, compared to un-initialized climate change projections? and (2) Is the prediction model’s ensemble spread an appropriate representation of forecast uncertainty on average? The first question is addressed through deterministic metrics that compare the initialized and uninitialized hindcasts. The second question is addressed through a probabilistic metric applied to the initialized hindcasts and comparing different ways to ascribe forecast uncertainty. Verification is advocated at smoothed regional scales that can illuminate broad areas of predictability, as well as at the grid scale, since many users of the decadal prediction experiments who feed the climate data into applications or decision models will use the data at grid scale, or downscale it to even higher resolution. An overall statement on skill of CMIP5 decadal hindcasts is not the aim of this paper. The results presented are only illustrative of the framework, which would enable such studies. However, broad conclusions that are beginning to emerge from the CMIP5 results include (1) Most predictability at the interannual-to-decadal scale, relative to climatological averages, comes from external forcing, particularly for temperature; (2) though moderate, additional skill is added by the initial conditions over what is imparted by external forcing alone; however, the impact of initialization may result in overall worse predictions in some regions than provided by uninitialized climate change projections; (3) limited hindcast records and the dearth of climate-quality observational data impede our ability to quantify expected skill as well as model biases; and (4) as is common to seasonal-to-interannual model predictions, the spread of the ensemble members is not necessarily a good representation of forecast uncertainty. The authors recommend that this framework be adopted to serve as a starting point to compare prediction quality across prediction systems. The framework can provide a baseline against which future improvements can be quantified. The framework also provides guidance on the use of these model predictions, which differ in fundamental ways from the climate change projections that much of the community has become familiar with, including adjustment of mean and conditional biases, and consideration of how to best approach forecast uncertainty.

Driscoll, S., A. Bozzo, L. J. Gray, A. Robock, and G. Stenchikov (2012), Coupled Model Intercomparison Project 5 (CMIP5) simulations of climate following volcanic eruptions, J. Geophys. Res., 117, D17105, doi:10.1029/2012JD017607. published 6 September 2012.

Abstract

The ability of the climate models submitted to the Coupled Model Intercomparison Project 5 (CMIP5) database to simulate the Northern Hemisphere winter climate following a large tropical volcanic eruption is assessed. When sulfate aerosols are produced by volcanic injections into the tropical stratosphere and spread by the stratospheric circulation, it not only causes globally averaged tropospheric cooling but also a localized heating in the lower stratosphere, which can cause major dynamical feedbacks. Observations show a lower stratospheric and surface response during the following one or two Northern Hemisphere (NH) winters, that resembles the positive phase of the North Atlantic Oscillation (NAO). Simulations from 13 CMIP5 models that represent tropical eruptions in the 19th and 20th century are examined, focusing on the large-scale regional impacts associated with the large-scale circulation during the NH winter season. The models generally fail to capture the NH dynamical response following eruptions. They do not sufficiently simulate the observed post-volcanic strengthened NH polar vortex, positive NAO, or NH Eurasian warming pattern, and they tend to overestimate the cooling in the tropical troposphere. The findings are confirmed by a superposed epoch analysis of the NAO index for each model. The study confirms previous similar evaluations and raises concern for the ability of current climate models to simulate the response of a major mode of global circulation variability to external forcings. This is also of concern for the accuracy of geoengineering modeling studies that assess the atmospheric response to stratosphere-injected particles.

Mauritsen, T., et al. (2012), Tuning the climate of a global model, J. Adv. Model. Earth Syst., 4, M00A01, doi:10.1029/2012MS000154. published 7 August 2012.

Abstract

During a development stage global climate models have their properties adjusted or tuned in various ways to best match the known state of the Earth’s climate system. These desired properties are observables, such as the radiation balance at the top of the atmosphere, the global mean temperature, sea ice, clouds and wind fields. The tuning is typically performed by adjusting uncertain, or even non-observable, parameters related to processes not explicitly represented at the model grid resolution. The practice of climate model tuning has seen an increasing level of attention because key model properties, such as climate sensitivity, have been shown to depend on frequently used tuning parameters. Here we provide insights into how climate model tuning is practically done in the case of closing the radiation balance and adjusting the global mean temperature for the Max Planck Institute Earth System Model (MPI-ESM). We demonstrate that considerable ambiguity exists in the choice of parameters, and present and compare three alternatively tuned, yet plausible configurations of the climate model. The impacts of parameter tuning on climate sensitivity was less than anticipated.

Jiang, J. H., et al. (2012), Evaluation of cloud and water vapor simulations in CMIP5 climate models using NASA “A-Train” satellite observations, J. Geophys. Res., 117, D14105, doi:10.1029/2011JD017237. published 18 July 2012.

Using NASA’s A-Train satellite measurements, we evaluate the accuracy of cloud water content (CWC) and water vapor mixing ratio (H2O) outputs from 19 climate models submitted to the Phase 5 of Coupled Model Intercomparison Project (CMIP5), and assess improvements relative to their counterparts for the earlier CMIP3. We find more than half of the models show improvements from CMIP3 to CMIP5 in simulating column-integrated cloud amount, while changes in water vapor simulation are insignificant. For the 19 CMIP5 models, the model spreads and their differences from the observations are larger in the upper troposphere (UT) than in the lower or middle troposphere (L/MT). The modeled mean CWCs over tropical oceans range from ∼3% to ∼15× of the observations in the UT and 40% to 2× of the observations in the L/MT. For modeled H2Os, the mean values over tropical oceans range from ∼1% to 2× of the observations in the UT and within 10% of the observations in the L/MT. The spatial distributions of clouds at 215 hPa are relatively well-correlated with observations, noticeably better than those for the L/MT clouds. Although both water vapor and clouds are better simulated in the L/MT than in the UT, there is no apparent correlation between the model biases in clouds and water vapor. Numerical scores are used to compare different model performances in regards to spatial mean, variance and distribution of CWC and H2O over tropical oceans. Model performances at each pressure level are ranked according to the average of all the relevant scores for that level.

From the conclusions: “Tropopause layer water vapor is poorly simulated with respect to observations. This likely results from temperature biases.”

Sakaguchi, K., X. Zeng, and M. A. Brunke (2012), The hindcast skill of the CMIP ensembles for the surface air temperature trend, J. Geophys. Res., 117, D16113, doi:10.1029/2012JD017765. published 28 August 2012

Linear trends of the surface air temperature (SAT) simulated by selected models from the Coupled Model Intercomparison Project (CMIP3 and CMIP5) historical experiments are evaluated using observations to document (1) the expected range and characteristics of the errors in hindcasting the ‘change’ in SAT at different spatiotemporal scales, (2) if there are ‘threshold’ spatiotemporal scales across which the models show substantially improved performance, and (3) how they differ between CMIP3 and CMIP5. Root Mean Square Error, linear correlation, and Brier score show better agreement with the observations as spatiotemporal scale increases but the skill for the regional (5° × 5° – 20° × 20° grid) and decadal (10 – ∼30-year trends) scales is rather limited. Rapid improvements are seen across 30° × 30° grid to zonal average and around 30 years, although they depend on the performance statistics. Rather abrupt change in the performance from 30° × 30° grid to zonal average implies that averaging out longitudinal features, such as land-ocean contrast, might significantly improve the reliability of the simulated SAT trend. The mean bias and ensemble spread relative to the observed variability, which are crucial to the reliability of the ensemble distribution, are not necessarily improved with increasing scales and may impact probabilistic predictions more at longer temporal scales. No significant differences are found in the performance of CMIP3 and CMIP5 at the large spatiotemporal scales, but at smaller scales the CMIP5 ensemble often shows better correlation and Brier score, indicating improvements in the CMIP5 on the temporal dynamics of SAT at regional and decadal scales.

Comments Off on More CMIP5 Regional Model Shortcomings

Filed under Climate Models, Research Papers

Comments On “The Shifting Probability Distribution Of Global Daytime And Night-Time Temperatures” By Donat and Alexander 2012 – A Not Ready For Prime Time Study

above figure from Caesar et al 2006

A new paper has appeared;

Donat, M. G. and L. V. Alexander (2012), The shifting probability distribution of global daytime and night-time temperatures, Geophys. Res. Lett., 39, L14707, doi:10.1029/2012GL052459.

The abstract reads [highlight added]

Using a global observational dataset of daily gridded maximum and minimum temperatures we investigate changes in the respective probability density functions of both variables using two 30-year periods; 1951–1980 and 1981–2010. The results indicate that the distributions of both daily maximum and minimum temperatures have significantly shifted towards higher values in the latter period compared to the earlier period in almost all regions, whereas changes in variance are spatially heterogeneous and mostly less significant. However asymmetry appears to have decreased but is altered in such a way that it has become skewed towards the hotter part of the distribution. Changes are greater for daily minimum (night-time) temperatures than for daily maximum (daytime) temperatures. As expected, these changes have had the greatest impact on the extremes of the distribution and we conclude that the distribution of global daily temperatures has indeed become “more extreme” since the middle of the 20th century.

This study, unfortunately, perpetuates the use of Global Historical Climate Reference Network surface temperature data as being a robust measure of surface temperature trends. The authors report that

 We use HadGHCND [Caesar et al., 2006], a global gridded data set of observed near-surface daily minimum (Tmin) and maximum (Tmax) temperatures from weather stations, available from 1951 and updated to 2010. For this study, we consider daily Tmax and Tmin anomalies calculated with respect to the 1961 to 1990 daily climatological average.

As described in the paper

Caesar, J., L. Alexander, and R. Vose (2006), Large-scale changes in observed daily maximum and minimum temperatures: Creation and analysis of a new gridded data set, J. Geophys. Res., 111, D05101, doi:10.1029/2005JD006280.

A gridded land-only data set representing near-surface observations of daily maximum and minimum temperatures (HadGHCND) has been created to allow analysis of recent changes in climate extremes and for the evaluation of climate model simulations. Using a global data set of quality-controlled station observations compiled by the U.S. National Climatic Data Center (NCDC), daily anomalies were created relative to the 1961–1990 reference period for each contributing station. An angular distance weighting technique was used to interpolate these observed anomalies onto a 2.5° latitude by 3.75° longitude grid over the period from January 1946 to December 2000. We have used the data set to examine regional trends in time-varying percentiles. Data over consecutive 5 year periods were used to calculate percentiles which allow us to see how the distributions of daily maximum and minimum temperature have changed over time. Changes during the winter and spring periods are larger than in the other seasons, particularly with respect to increasing temperatures at the lower end of the maximum and minimum temperature distributions. Regional differences suggest that it is not possible to infer distributional changes from changes in the mean alone.

The Donat and Alexander 2012 article concludes with the text

Using the data from this study we conclude that daily temperatures (both daytime and night-time) have indeed become “more extreme” and that these changes are related to shifts in multiple aspects of the daily temperature distribution other than just changes in the mean. However evidence is less conclusive as to whether it has become “more variable”.

The Donat and Alexander (2012) paper and the Caesar et al (2006) paper, however, both suffer in their ignoring issues that have been raised regarding the robustness of the data they are using for their analyses. They either ignored or are unaware of papers that show that the conclusions they give cannot be considered accurate unless they can show that the unresolved uncertainties  have either been corrected for, or shown not to affect their analyses. An overview of these issues is given in

Pielke Sr., R.A., C. Davey, D. Niyogi, S. Fall, J. Steinweg-Woods, K. Hubbard, X. Lin, M. Cai, Y.-K. Lim, H. Li, J. Nielsen-Gammon, K. Gallo, R. Hale, R. Mahmood, S. Foster, R.T. McNider, and P. Blanken, 2007: Unresolved issues with   the assessment of multi-decadal global land surface temperature trends. J. Geophys. Res., 112, D24S08, doi:10.1029/2006JD008229.

which the authors ignored in their study. The questions the authors did not examine before accepting the robustness of their analyses include:

1. The quality of station siting in the HadGHCND and whether this affects the extreme surface temperatures [Pielke et al 2002; Mahmood et al 2006Fall et al 2011; Martinez et al 2012].

2. The effect of a concurrent change over time in the dew point temperatures at each HadGHCND location, which, if they are lower, could result in higher dry bulb temperatures [Davey et al 2006; Fall et al 2010; Peterson et al 2011 ]

3.  A bias in the siting of the HadGHCND observing sites for particular landscape types [Montandon et al 2011]

4. Small scale vegetation effects on maximum and minimum temperatures observed at HadGHCND sites [Hanamean et al 2003]

5. The uncertainty associated with each separate step in the HadGHCND homogenization method to develop grid area averages [Pielke 2005].

6. The warm bias that is expected to be in the HadGHCND with respect  to minimum temperatures [which would be expected to be even more pronounced with respect to extreme cold temperatures] [Klotzbach et al 2010,2011; McNider et al 2012].

As just one example from the above list, Mahmood et al 2006 finds that

…the difference in average extreme monthly minimum temperatures can be as high as 3.6 °C between nearby stations, largely owing to the differences in instrument exposures.’

Note also in the figure at the top of this post, the poor spatial sampling for large portions of land.

The conclusion is that the HadGHCND data set is NOT sufficiently quality controlled, despite the assumption of the authors to the contrary. Ignoring peer reviewed papers that raise issues with their methodology does not follow the scientific  method.

The complete cite for these peer-reviewed papers that were ignored are listed below:

Davey, C.A., R.A. Pielke Sr., and K.P. Gallo, 2006: Differences between  near-surface equivalent temperature and temperature trends for the eastern  United States – Equivalent temperature as an alternative measure of heat  content. Global and Planetary Change, 54, 19–32.

Fall, S., N. Diffenbaugh, D. Niyogi, R.A. Pielke Sr., and G. Rochon, 2010: Temperature and equivalent temperature over the United States (1979 – 2005). Int. J. Climatol., DOI: 10.1002/joc.2094.

Fall, S., A. Watts, J. Nielsen-Gammon, E. Jones, D. Niyogi, J. Christy, and R.A. Pielke Sr., 2011: Analysis of the impacts of station exposure on the U.S. Historical Climatology Network temperatures and temperature trends. J. Geophys. Res.,  116, D14120, doi:10.1029/2010JD015146.Copyright (2011) American Geophysical Union.

Hanamean,  J.R. Jr., R.A. Pielke Sr., C.L. Castro, D.S. Ojima, B.C. Reed, and Z.  Gao, 2003: Vegetation impacts on maximum and minimum temperatures in northeast  Colorado. Meteorological Applications, 10, 203-215.

Klotzbach, P.J., R.A. Pielke Sr., R.A. Pielke Jr.,  J.R. Christy, and R.T. McNider, 2009: An alternative explanation for differential temperature trends at the  surface and in the lower troposphere. J. Geophys. Res., 114, D21102, doi:10.1029/2009JD011841.

Klotzbach, P.J., R.A. Pielke Sr., R.A. Pielke Jr.,  J.R. Christy, and R.T. McNider, 2010: Correction to: “An alternative explanation for differential temperature trends at the  surface and in the lower troposphere. J. Geophys. Res., 114, D21102, doi:10.1029/2009JD011841″, J. Geophys. Res.,  115, D1, doi:10.1029/2009JD013655

Mahmood, R., S. A. Foster, and D. Logan (2006a), The geoprofile metadata, exposure of instruments, and measurement bias in climatic record revisited, Int. J. Climatol., 26, 1091–1124.

Martinez, C.J., Maleski, J.J., Miller, M.F, 2012: Trends in precipitation and temperature in Florida, USA. Journal of Hydrology. volume 452-453, issue , year 2012, pp. 259 – 281

McNider, R.T., G.J. Steeneveld, B. Holtslag, R. Pielke Sr, S.   Mackaro, A. Pour Biazar, J.T. Walters, U.S. Nair, and J.R. Christy, 2012: Response and sensitivity of the nocturnal boundary layer over  land to added longwave radiative forcing. J. Geophys. Res., doi:10.1029/2012JD017578, in press.

Montandon, L.M., S. Fall, R.A. Pielke Sr., and D. Niyogi, 2011: Distribution of landscape types in the Global Historical Climatology Network. Earth Interactions, 15:6, doi: 10.1175/2010EI371

Peterson, T. C., K. M. Willett, and P. W. Thorne (2011), Observed changes in surface atmospheric energy over land, Geophys. Res. Lett., 38, L16707, doi:10.1029/2011GL048442

Pielke Sr., R.A., T. Stohlgren, L. Schell, W. Parton, N. Doesken, K. Redmond,  J. Moeny, T. McKee, and T.G.F. Kittel, 2002: Problems in evaluating regional  and local trends in temperature: An example from eastern Colorado, USA.  Int. J. Climatol., 22, 421-434.

Pielke Sr., Roger A., 2005: Public Comment on CCSP Report “Temperature Trends  in the Lower Atmosphere: Steps for Understanding and Reconciling Differences“. 88 pp including appendices.

The Donat and Alexander (2012) is particularly at fault in this neglect as most of the papers questioning the robustness of the GHCN type data sets were published well before their article was completed.  The conclusions of the Donat and Alexander study should not be considered as robust until they address the issues we raised in our papers.  

Comments Off on Comments On “The Shifting Probability Distribution Of Global Daytime And Night-Time Temperatures” By Donat and Alexander 2012 – A Not Ready For Prime Time Study

Filed under Climate Change Metrics, Climate Science Misconceptions, Research Papers

New Paper “Summer-Time Climate Impacts Of Projected Megapolitan Expansion in Arizona” By Georgescu Et Al 2012

Figure 1 from Georgescu et al 2012: with caption  “Observed time series of the mean summer-time temperature and diurnal temperature range at an urbanizing and non-urbanizing station”.

I was alerted to a news report on the excellent Nature Climate Change article by Matei Georgescu and colleagues.

Georgescu, M. et al 2012: Summer-time climate impacts of projected megapolitan expansion in Arizona. Nature Climate Change. doi:10.1038/nclimate1656

with the abstract [highlight added]

Efforts characterizing the changing climate of southwestern North America by focusing exclusively on the impacts of increasing levels of long-lived greenhouse gases omit fundamental elements with similar order-of-magnitude impacts as those owing to large-scale climate change. Using a suite of ensemble-based, multiyear simulations, here we show the intensification of observationally based urban-induced phenomena and demonstrate that the direct summer-time climate effects of the most rapidly expanding megapolitan region in the USA—Arizona’s Sun Corridor—are considerable. Although urban-induced warming approaches 4 °C locally for the maximum expansion scenario, impacts depend on the particular trajectory of development. Cool-roof implementation reduces simulated warming by about 50%, yet decreases in summer-time evapotranspiration remain at least as large as those from urban expansion without this mode of adaptation. The contribution of urban-induced warming relative to mid- and end-of-century climate change illustrates strong dependence on built environment expansion scenarios and emissions pathways. Our results highlight the direct climate impacts that result from newly emerging megapolitan regions and their significance for overcoming present challenges concerning sustainable development.

The news article by Rebecca Thomas on this new research article is reproduced below [with highlighting]

ASU study: Urban sprawl might cause higher summer temps

TEMPE, AZ (CBS5) -We live in a desert and expect our summer heat.

But, how much worse can it get?

According to a new study by Arizona State University’s School of Geographical and Urban Planning and its School of Mathematical and Statistical Sciences, temperatures in a large portion of our state could jump between 2 to 7 degrees in the several decades as a result of urban sprawl.

They say because we live in the fastest growing megapolitan in the United States, we could see an expansion of what we’ve come to know as the “Heat Island Effect.”

Basically, the more concrete you have in terms of buildings and roads, the hotter it gets during the day.

And, because concrete and asphalt absorbs and then releases heat, it cools off less at night.

“Further potential urbanization can make things considerably warmer,” said Matei Georgescu, the study’s lead author and an assistant professor at ASU’s School of Geographical Sciences and Urban Planning.

Using growth projections by the Maricopa Association of Governments for Arizona’s Sun Corridor, which includes Phoenix, Prescott, Tucson and Nogales, researchers identified potential temperature increases by 2050.

“Worst-case scenario locally, we’re looking at an increase during the summertime of 7 degrees,” said Georgescu.

Best-case scenario with less growth, we’re looking at a 2- to 3-degree increase in summer temps.

Georgescu says even if the Sun Corridor grows unchecked, maximum potential temperature increases could be cut in half by simply painting building rooftops white.

“What happens is a lot more of the incoming radiation is reflected back to space,” he said.

Looking ahead, Georgescu points out there are things we can do to offset the consequences of urbanization, such as planting trees for shade.

Using porous asphalt will prevent run-off and allow monsoon rain to be absorbed and then released back into the atmosphere.

“Direct evaporation is an immediate cooling effect, he said. So, it allows for an additional way to cool the local land surface.”

Georgescu stresses this is an important area of study because urbanization-induced warming can have up to three times the impact on our climate than green house gases.

“Really, what this tells you is there is tremendous opportunity for Arizona to grow sustainably and incorporate different strategies for adaptation and mitigation.

If you’d like to read more about this ASU study, it’s published in the journal Nature Climate Change.

This excellent study is yet another example of why the role in human climate forcings must broaden well beyond just the role of added greenhouse gases. We have urged this broader view, for example, in our paper

Pielke Sr., R., K.  Beven, G. Brasseur, J. Calvert, M. Chahine, R. Dickerson, D.  Entekhabi, E. Foufoula-Georgiou, H. Gupta, V. Gupta, W. Krajewski, E.  Philip Krider, W. K.M. Lau, J. McDonnell,  W. Rossow,  J. Schaake, J.  Smith, S. Sorooshian,  and E. Wood, 2009: Climate change: The need to consider human forcings besides greenhouse gases.   Eos, Vol. 90, No. 45, 10 November 2009, 413. Copyright (2009) American   Geophysical Union.

Other news articles on the Georgescu et al 2012 study include

ASU Study: Arizona will only get hotter by Jared Dillingham

and

City Temps May Soar From Urbanization, Global Warming by Michael D. Lemonick

where the end of the article reads

“It’s possible, it’s practical, and it could cut the projected temperature increase in half,” Georgescu said. Unfortunately, he added, it doesn’t help at all with another urbanization-related problem. When you pave or build over undeveloped land, you seal in whatever moisture there is in the soil. It can no longer evaporate, which cuts off an important source of humidity, and ultimately, of rain.

“So one of our take-home messages,” he said, “is that to be truly sustainable, you can’t just focus on temperatures. The climate system isn’t only about warming.”

Comments Off on New Paper “Summer-Time Climate Impacts Of Projected Megapolitan Expansion in Arizona” By Georgescu Et Al 2012

Filed under Climate Change Forcings & Feedbacks, Climate Science Reporting, Research Papers

New Article “Monitoring and Understanding Trends in Extreme Storms: State of Knowledge” By Kunkel Et Al 2012

Jos de Laat of KNMI has alerted us to the informative new paper

Kunkel, K, et al 2012: Monitoring and Understanding Trends in Extreme Storms: State of Knowledge. Bulletin of the American Meteorological Society 2012 ; doi: http://dx.doi.org/10.1175/BAMS-D-11-00262.1

The abstract reads [highlight added]

The state of knowledge regarding trends and an understanding of their causes is presented for a specific subset of extreme weather and climate types. For severe convective storms (tornadoes, hail storms, and severe thunderstorms), differences in time and space of practices of collecting reports of events make the use of the reporting database to detect trends extremely difficult. Overall, changes in the frequency of environments favorable for severe thunderstorms have not been statistically significant. For extreme precipitation, there is strong evidence for a nationally-averaged upward trend in the frequency and intensity of events. The causes of the observed trends have not been determined with certainty, although there is evidence that increasing atmospheric water vapor may be one factor. For hurricanes and typhoons, robust detection of trends in Atlantic and western North Pacific tropical cyclone (TC) activity is significantly constrained by data heterogeneity and deficient quantification of internal variability. Attribution of past TC changes is further challenged by a lack of consensus on the physical linkages between climate forcing and TC activity. As a result, attribution of trends to anthropogenic forcing remains controversial. For severe snowstorms and ice storms, the number of severe regional snowstorms that occurred since 1960 was more than twice that of the preceding 60 years. There are no significant multi-decadal trends in the areal percentage of the contiguous U.S. impacted by extreme seasonal snowfall amounts since 1900. There is no distinguishable trend in the frequency of ice storms for the U.S. as a whole since 1950.

The article is an important new contribution in the assessment of changes in climate metrics over time. I have, however, one comments about the analyses and their conclusions in regards to their suggestion of attributing an increase in extreme precipitation to an increase in atmospheric water vapor.  Kunkel et al 2012 write

Karl and Trenberth (2003) have empirically demonstrated that for the same annual or seasonal precipitation totals, warmer climates generate more extreme precipitation events compared to cooler climates. This is consistent with water vapor being a critical limiting factor for the most extreme precipitation events. A number of analyses have documented significant positive trends in water vapor concentration and have linked these trends to human fingerprints in both changes of surface (Willet et al.2007) and atmospheric moisture (Santer et al. 2007).

The authors present analyses in their Table 2 to document an increase in atmospheric water vapor. They describe their analysis in the Table caption as

Table 2. Differences between two periods (1990-2009 minus 1971-845 1989) for daily, 1-in-5yr extreme events and maximum precipitable water values measured in the spatial vicinity of the extreme event location and within 24 hours of the event time.

However, in their analysis they use just two blocks of time (1990-2009) and (1971-1989) when different sliding analysis windows should have been used, in order to assess our robust there finding is with respect to sampling window.

They also should consider a peer-reviewed study which yields a different finding when assessing the overall North American trend in precipitable water;

Wang, J.-W., K. Wang, R.A. Pielke, J.C. Lin, and T. Matsui, 2008: Towards a robust test on North America warming trend and precipitable water content increase. Geophys. Res. Letts., 35, L18804, doi:10.1029/2008GL034564. https://pielkeclimatesci.files.wordpress.com/2009/10/r-337.pdf

where we report

An increase in the atmospheric moist content has been generally assumed when the lower-tropospheric temperature (Tcol) increases, with relative humidity holding steady. Rather than using simple linear regression, we propose a more rigorous trend detection method that considers time series memory. The autoregressive moving-average (ARMA) parameters for the time series of Tcol, precipitable water vapor (PWAV), and total precipitable water content (PWAT) from the North American Regional Reanalysis data were first computed. We then applied the Monte Carlo method to replicate the ARMA time series samples to estimate the variances of their Ordinary Least Square trends. Student’s t tests showed that Tcol from 1979 to 2006 increased significantly; however, PWAVand PWAT did not. This suggests that atmospheric temperature and water vapor trends do not follow the conjecture of constant relative humidity over North America. We thus urge further evaluations of Tcol, PWAV, and PWAT trends for the globe.

They also did not consider peer-reviewed papers on the role of land use change in altering extreme precipitation events, where irrigation of surrounding landscapes when dams are constructed, appears to enhance extreme precipitation at least in arid and semi-arid landscapes through the enhancement of convective available potential energy (CAPE); e.g. see

Degu, A. M., F. Hossain, D. Niyogi, R. Pielke Sr., J. M. Shepherd, N. Voisin, and T. Chronis, 2011: The influence of large dams on surrounding climate and precipitation patterns. Geophys. Res. Lett., 38, L04405, doi:10.1029/2010GL046482.

In this paper we wrote

Understanding the forcings exerted by large dams on local climate is key to establishing if artificial reservoirs inadvertently modify precipitation patterns in impounded river basins. Using a 30 year record of reanalysis data, the spatial gradients of atmospheric variables related to precipitation formation are identified around the reservoir shoreline for 92 large dams of North America. Our study reports that large dams influence local climate most in Mediterranean, and semi‐arid climates, while for humid climates the influence is least apparent. Clear spatial gradients of convective available potential energy, specific humidity and surface evaporation are also observed around the fringes between the reservoir shoreline and farther from these dams. Because of the increasing correlation observed between CAPE and extreme precipitation percentiles, our findings point to the possibility of storm intensification in impounded basins of the Mediterranean and arid climates of the United States.

Another example of a study that documents how landscape change in the United States can alter precipitation patterns, including intensity, is

Georgescu, M., D. B. Lobell, and C. B. Field (2009), The Potential Impact of US biofuels on Regional Climate, Geophys. Res. Lett., In Press, doi: 10.1029/2009GL040477

who reported that

Using the latest version of the WRF modeling system we conducted twenty-four, midsummer, continental-wide, sensitivity experiments by imposing realistic biophysical parameter limits appropriate for bio-energy crops in the Corn Belt of the United States….. Maximum, local changes in 2m temperature of the order of 1°C occur for the full breadth of albedo (ALB), minimum canopy resistance (RCMIN), and rooting depth (ROOT) specifications, while the regionally (105°W – 75°W and 35°N – 50°N) and monthly averaged response of 2m temperature was most pronounced for the ALB and RCMIN experiments, exceeding 0.2°C….The full range of albedo variability associated with biofuel crops may be sufficient to drive regional changes in summertime rainfall.

An increase in surface temperature would increase CAPE (and the resultant intensity of thunderstorms) if the water vapor content remained the same (or increased).

Urban landscapes also can contribute to enhancing the magnitude of extreme precipitation; e.g. see

Lei, M., D. Niyogi, C. Kishtawal, R. Pielke Sr., A. Beltrán-Przekurat, T. Nobis, and S. Vaidya, 2008: Effect of explicit urban land surface representation on the simulation of the 26 July 2005 heavy rain event over Mumbai, India. Atmos. Chem. Phys. Discussions, 8, 8773–8816

where among the conclusions is written

The results indicate that even for this synoptically active rainfall event, the vertical wind and precipitation are significantly influenced by urbanization, and the effect is more significant during the storm initiation…….The results suggest that urbanization can significantly contribute to extremes in monsoonal rain events that have been reported to be on the rise;

and see also, as another example,

Georgescu, M., G. Miguez-Macho, L. T. Steyaert, and C. P. Weaver (2009), Climatic effects of 30 years of landscape change over the Greater Phoenix, Arizona, region: 2. Dynamical and thermodynamical response, J. Geophys. Res., doi:10.1029/2008JD010762.

where in his guest post on February 9 2009 wrote

Our modeling results show a systematic difference in total accumulated precipitation between the most recent (2001) and least recent (1973) landscape reconstructions: a rainfall enhancement for 2001 relative to the 1973 landscape.

We recommend that in the next assessment led by Ken Kunkel and colleagues they include consideration of the role of landscape processes in affecting extreme weather over the United States (and elsewhere).

source of image

Comments Off on New Article “Monitoring and Understanding Trends in Extreme Storms: State of Knowledge” By Kunkel Et Al 2012

Filed under Climate Change Metrics, Research Papers