Monthly Archives: March 2010

New Paper ” Dam Safety Effects Due To Human Alteration Of Extreme Precipitation” By Hossain Et Al 2010

Our paper

 Hossain, F., I. Jeyachandran, and R.A. Pielke Sr., 2010: Dam safety effects due to human alteration of extreme precipitation. Water Resources Research, 46, W03301, doi:10.1029/2009WR007704

has appeared.

The abstract reads

“Very little is known about the vulnerability of dams and reservoirs to man‐made alteration of extreme precipitation and floods as we step into the 21st century. This is because conventional dam and reservoir design over the last century has been “one‐way” with no acknowledgment of the possible feedback mechanisms affecting the regional water cycle. Although the notion that an impoundment could be built to increase rainfall was suggested more than 60 years ago, dam design protocol in civil engineering continues to assume as “static” the statistical parameters of a low exceedance probability precipitation event during the lifespan of the dam. It is time for us to change our perceptions and embrace a hydrometeorological approach to dam design and operations.”

Our conclusion reads

“Today, we know little about the impact of dams and reservoirs on the alteration in precipitation patterns as we step into the 21st century. Dam design protocol in civil engineering continues to assume as “static” the statistical parameters of a low exceedance probability precipitation event during the life span of the dam. Our study seems to indicate that the impact of large dams on extreme precipitation is clearly a function of surrounding mesoscale and land use conditions [e.g., see Pielke et al., 2007; Douglas et al., 2009], and that more research is necessary to gain insights on the physical mechanisms of extreme precipitation alteration by dams. The changes in land use, for example from added irrigation, add a significant amount of water vapor into the atmosphere in the growing season, thereby fueling showers and thunderstorms [e.g., see Pielke and Zeng, 1989; Pielke et al., 1997; Pielke, 2001]. Such landscape changes can even alter large‐scale precipitation patterns such as the Asian monsoon [e.g., see Takata et al., 2008].”

“Although the focus of our paper is primarily on how dams may alter extreme precipitation patterns and consequentially the flood frequency relationship, we should also recognize that there are other direct ways that the discharge into a reservoir may increase in frequency and magnitude (such as urbanization and other changes in land cover). Whatever the possible causes might be, it is timely for the civil engineering profession to change perceptions and embrace an interactive hydrology‐atmospheric science approach to safe dam design and operations for the 21st century.”

Comments Off on New Paper ” Dam Safety Effects Due To Human Alteration Of Extreme Precipitation” By Hossain Et Al 2010

Filed under Climate Change Forcings & Feedbacks

Guest Post By Hiroshi L. Tanaka On The New Paper “Data Analysis Of Recent Warming Pattern In The Arctic” By Ohashi And Tanaka

Guest post by Hiroshi L. Tanaka of the University of the University of Tsukuba in Japan [his webpage is http://air.geo.tsukuba.ac.jp/~tanaka/

Guest Post

Dr. Kiminori Itoh suggested I contact you to explain our recent work on misleading global warming predictions in reference to the comprehensive study on the Arctic Oscillation [AO]. As you have 
experienced, the winter of 2009/2010 reminded us of the global cool weather rather than global warming. The occurrence of the extreme AO minus (3 sigma) provided us additional evidence that the AO controls a large fraction of global warming.

We have a paper that was published on 13 March 2010 with my student Mr. Ohashi in SOLA:

Masahiro Ohashi and H. L. Tanaka, 2010: Vol. 6A (2010) : Data Analysis of Recent Warming Pattern in the Arctic. Special Edition -Special Edition of the Fourth Japan China Korea Joint Conference on Meteorology- p.1-4

The abstract reads

“In this study, we investigate the mechanism of the arctic warming pattern in surface air temperature (SAT) and sea ice concentrations over the last two decades in comparison with global warming since the 1970s.

According to the analysis result, it is found that the patterns of SAT and sea ice before 1989 are mostly determined by the Arctic Oscillation (AO) in winter. In contrast, arctic warming patterns after 1989 are characterized by the intensification of the Beaufort High and the reduced sea-ice concentrations in summer induced by the positive ice-albedo feedback.

It is concluded that the arctic warming before 1989 especially in winter was explained by the positive trend of the AOI. Moreover the intensified Beaufort High and the drastic decrease of the sea ice concentrations in September after 1989 were associated with the recent negative trend of the AOI. Since the decadal variation of the AO is recognized as the natural variability of the global atmosphere, it is shown that both of decadal variabilities before and after 1989 in the Arctic can be mostly explained by the natural variability of the AO not by the external response due to the human activity.”

Professor Tanaka summarized the significance of their papers for us in the following:

The main conclusions are:

(1)  The most dominant trend in observation for 1950-1999 shows  an AO pattern (natural variability), while the most dominant trend in the IPCC models shows an ice-albedo feedback pattern (anthropogenic forcing).

(2)  In the observations, the AO pattern appears as the EOF-1. However, in the IPCC 10 model mean, the ice-albedo pattern appears as EOF-1 (which is not seen in the observation), and the AO pattern appears as EOF-2.

(3)  In the EOF analysis, the ratio of variance for the ice-albedo and AO patterns are 5:2. Since the AO is a realization of a stochastic process, the variance of the AO pattern in the observations dominates the ice-albedo pattern (5:20 in theory).

(4)  Multi-decadal trends of surface air temperatures [SAT] indicates that the AO  was negative for 1950-1969, the AO was positive for 1969-1989, and the AO was negative for 1989-2008 (2010 is the extreme value). Those are realized as the natural variability superimposed on the general trend of global warming.

Implications:

According to our result, the rapid warming during 1970-1990 contains a large fraction of unpredictable natural variability due to the AO. The subsequent period of 1990-2010 indicates a clear trend of the AO to be negative. The global warming has been stopped by natural variability superimposed on the gentle anthropogenic global warming. The important point is that the IPCC models have been tuned perfectly to fit the rapid warming during 1970-1990 by means of the ice-albedo feedback (anthropogenic forcing) which is not actually observed. IPCC models are justified with this wrong scientific basis and are applied to project the future global warming for 100 years in the future. Hence, we warn that the IPCC models overestimate the warming trend due to the mislead Arctic Oscillation.

Comments Off on Guest Post By Hiroshi L. Tanaka On The New Paper “Data Analysis Of Recent Warming Pattern In The Arctic” By Ohashi And Tanaka

Filed under Climate Change Forcings & Feedbacks, Guest Weblogs

Guest Post On Wind Energy By Dr. C. (Kees) Le Pair

GUEST POST Dr. C. (Kees) Le Pair

Recently we published 2 articles, along the same line, about the coupling of wind parks to the electricity grid.
At the request of Henk Tennekes I am sending you the references:

http://www.clepair.net/windsecret.html

http://www.clepair.net/windefficiency.html

The first is based mainly on German data. The second on Dutch data. The latter contains actual info on fuel efficiencies of the national power network plus some info on the energy costs of windmill installation provided by one of the firms heavily involved in the set up of wind parks.

Hope to have been of some use, yours sincerely,

Dr. C. (Kees) le Pair

Comments Off on Guest Post On Wind Energy By Dr. C. (Kees) Le Pair

Filed under Guest Weblogs

A Guest Post By Troels Halken to Henk Tennekes’s Wind Power Guest Post

A Guest Post By Troels Halken to Henk Tennekes’s  Post 

https://pielkeclimatesci.wordpress.com/2010/03/03/wind-power-is-no-solution-to-anything-a-guest-weblog-by-henk-tennekes/

[Troels has worked with venture  investements in the renewable energy sector and the past few years as a
 business developer in the wind industry. He also runs a blog on the webpage  of the Danish engineering magazine Ingeniøren http://ing.dk/blogs/halken]

“Wind energy is an engineer’s nightmare. To begin with, the energy density of flowing air is miserably low. Therefore, you need a massive contraption to catch one Megawatt at best, and a thousand of these to equal a single gas- or coal-fired power plant.”

One’s nightmare is another’s challenge. A 1MW turbine is about 50 meters high and has a rotor of 50 meters and on the order of 150-200 tons. This is the massive contraption Hank is talking about. Most turbines sold in Europe and US today are 2-3MW, which in turn means that you need 300-500 and not a thousand. This is only in nominal effect, as turbines for onshore have a capacity factor in the range of 0.20-0.40 depending on site and a conventional power plant 0.8-0.9. So we’re not right back to a thousand turbines to make the same amount of electricity as a conventional plant, but not far off either.

“If you design them for a wind speed of 15 m/s, they are useless at wind speeds below10 m/s and extremely dangerous at 20 m/s, unless feathered in time. Remember, power is proportional to the CUBE of the wind speed.”

Most turbines cut in at a wind speed of 3-4 m/s, reach their nominal production at 12-15 m/s and cut out at 25 m/s. A wind turbine is not dangerous at 20 m/s or at 30 m/s. A wind turbine is dangerous when there is nothing that acts as a brake on the rotor, and since this condition of overspeed will destroy the turbine, there are several safety systems to prevent this from happening. Most turbines made today are pitch controlled, meaning that the blades attack angle can be controlled. If just one of the blades are perpendicular to the rotational direction of the rotor, it will stop the turbine. Hence there is a safety system for each blade, that is activated by the speed of rotor. With three blades there are three independent brakes. Accidents stemming from overspeed do happen. Mostly on older turbines, mostly due to poor maintenance and/or human error.

“Old-fashioned Dutch windmills needed a two-man crew on 12-hour watch, seven days a week, because a runaway windmill first burns its bearings, then its hardwood gears, then the entire superstructure. This was the nightmare of millers everywhere in the ‘good’ old days.”

Todays turbines are made to be remote controlled, and the operator can sit anywhere in the world and log on to his wind park and individual wind turbine. However there is not much to operate, as the turbines control and surveillance system employs maybe a thousand sensors and several computers, all bound together with fiber optics.

“Since the power generated by modern wind turbines is so unpredictable, conventional power plants have to serve as back-ups. Therefore, these run at far less than half power most of the time. That is terribly uneconomical – only at full power they have good thermal efficiency and minimal CO2 emissions per kWh delivered.”

Conventional power plants does not run at half power, and often they are divided into units of 600-800MW and instead of running two units at half power, you close one of them.

The economy of doing such a thing depends on the economical structure of the power station in question. For nuclear, variable costs are low and fixed cost high, hence it is most economic to run it as much as possible. In the other end there are gas turbines, where the variable costs (price of fuel) is high and fixed costs are low.

“Think also a moment of the cable networks needed: not only a fine-maze distribution network at the consumer end, but also one at the generator end.”

A wind power plant (as that is the size these come in today) has its own internal cabling and just one point where it hooks up to the grid. As the turbines are located pretty close together, in reality it is not as bad as Henk make it seems.

“And what about servicing? How do you get a repair crew to a lonely hillside? Especially when you decided to put the wind park at sea? Use helicopters – now THAT is green …!”

For onshore parks, roads are made so the turbines can be transported to the site. The repair crew uses the same road and so far this has never been a problem. Turbines has been put up in mountains and deserts and in the arctic, and this has never been a problem.

For offshore it is a little different. In the winter access to these turbines are often problematic, due to waves. It is not fun to jump from a ship in 1 meter waves with 50 kg of tools and spare parts. The waves can prevent access to a turbine for weeks or months. So if one breaks down, service personnel is flown out. The alternative is that the turbines may be stopped for weeks.

To me it does not really matter if it is green, but lets see anyway. The motor of a helicopter may be 300kW compared to the turbine rating of 3MW. It is pretty simple that the turbine only needs to produce energy for a very short time to catch up for the co2 from the helicopter. So I guess that technically it is green, if that is important.

For me it is a question of economics. A turbine that does not produce energy means that the owner of the turbine is losing money, because just like a car, the bank still wants its payments if you drive in it or not, and the same goes for turbines. And the helicopter is easily paid for.

“For that matter, would you care to imagine what happens to rotor blades in freezing rain? Or how the efficiency of laminar-flow rotor blades decreases as bugs and dust accumulate on their leading edges?”

As with anything else, ice will accumulate on them and render them ineffective. For most places on earth this is not a problem, as the ice will melt in a few days. For arctic turbines it is different. Enercon has a system that can defrost the blades and others are also working on such systems.

Dirt on the blades is a issue, but various coatings are used and some washes the blades with intervals.

“German legislation gives wind power absolute priority, so all other forms of generating electricity have to back off when the wind starts blowing.”

This has also been a problem in Denmark but it is a part of the learning curve of integrating more wind energy into the grid. In Denmark the grid operator can shut down turbines in such an event. Also the energy produced by the turbines is sold to market price plus a premium, so when there is more energy due to high wind, the price goes down and it becomes uneconomical. The system still needs fine tuning of cause, but we don’t have the same problems as you mention.

“The synchronization of the system is also a scary job : alternating currents at 100,000 volts or more cannot be out of phase more than one degree or so, else circuit breakers pop everywhere and a brownout all over Europe starts.”

Todays turbines are equipped with a full converter, so the generator is decoupled from the grid through a DC link. Power electronics and computers in the turbine make sure that the DC is turned into the desired AC again. A converter can set the phase angle as desired, and hence deliver reactive power to the grid. Even when they are stopped they can do this partly.

So no browout over Europe.

“Nowhere I have been, be it Holland, Denmark, Germany, France, or California, have I seen wind parks where all turbines were operating properly. Typically, 20% stand idle, out of commission, broken down.”

The manufacturer warrants a availability factor of at least 95%. For older turbines it is different. In order to conclude anything on turbine availability in the field, I think it best to have data.

“I am an engineer; I want to be proud of my profession.”

I am an engineer too, and I am proud of what we can do and wind energy is a very interesting field.

A report from the Danish think tank CEPOS has gotten a lot of attention lately. However it has been heavily criticized by experts in Denmark, on the facts, conclusions and the fact that it was paid for by the oil industry.

Wind energy is not the answer to everything. But it may be part of an answer to something.

Wind energy is not perfect yet. But in thirty years it has come a long way. But there is also a message in that. As with many other energy sources, they take time to develop into something that is economical viable.

The price of energy is not a hardcoded truth, but a variable that varies according to the cheapest alternatives. These are oil, coal and gas. Oil being the far most important of the three is the gold standard and the price varies with demand and supply. EIA has recently made public that they believe in a peak oil production within the next 20 years and that is a first for EIA. We have also seen how no new oil fields in the giant or super giant class has been found since the 80’s, e.g. we’re long past peak discovery. Looking at the North Sea, the US and other early oil sites we know that after a peak discovery comes peak production. We have seen in the time leading up to the financial crisis, that Saudi Arabia with 13% of the worlds reserves could not turn production up and hence the price of oil soared to over 100 USD a barrel and stayed there. With a looming oil peak on the horizon and the roaring economic growth of India, China and South East Asia that fuels a rise in demand, we know that oil will become more expensive and we have to fight over the leftovers. We have already fought two wars in modern times, to secure supply of cheap oil. Our sons and daughters died so we could fill the tank of the SUV with reasonably cheap gas (and Cheney’s Haliburton could make billions in windfall profits). The price has been an alienating of the Arab world and a rise in the treat of terrorism. All this for cheap oil, cheap energy.

When the price of oil goes up, the price of natural gas also goes up and partly also for coal and demand moves to the cheapest alternative. So expensive oil means expensive fossil energy. Coal is there in plenty, but even when you don’t look at co2 emissions, it is still a dirty fuel. The particle emissions from coal is accused of causing lung diseases. It is difficult to see where a given particle came from and which particle caused the disease. But we can measure them in the air and coal contributes. Diseases and deaths cost money. So from a society perspective, this adds a price premium to coal, that is hidden in the health care costs.

Nuclear takes a long time to build and hence the demand changes slowly. Nuclear has a lot of potential and we should add more of this to our energy mix. But nuclear cannot serve all the worlds energy demand, but only some of it, as there is limited uranium reserves. Fusion, the other nuclear energy, was 50 years out 50 years ago and today it is still 50 years out, hence it is not the lifeboat.

Power from coal, oil and gas means that a big part of the electricity price is made up of variable costs, e.g. the cost of the fuel. The money paid for the fuel goes to the country where the fuel came from. In Denmark we have oil and gas  (but production is dropping), but no coal. In the US you have coal but not a lot of oil or gas. Wind energy means that the fuel is free. The machine that tap into this energy source is the thing that costs money. So the electricity price of wind energy is mostly made up of fixed costs and only minor variable costs (O&M), hence it is stable. The money paid for the wind turbine goes to where the parts where produced. Most wind turbine manufacturers have regional production and regional supply networks, as they are too expensive to transport around the world. So in essence, the money paid for wind electricity stays in the region for the most part.

There are other renewable sources of energy, but all have their own problems. Many of the technologies have potential but still have a long way to go, before delivering energy at a reasonable price.

One thing is possible though. To save energy. In Denmark we uses about half the energy per person as in the United States. This means that both private citizens uses less energy but also that our companies are more energy efficient. This is properly due to that fact that energy cost more over here, and then it makes a difference how much you use. With a higher energy price, this will come naturally.

Wind has come a long way the last thirty years. From simple 5KW machines to today’s mainstream 3MW machines. Today it is complicated machinery where you can find cutting edge technology within materials, testing, computer control just to mention a few. And the machines have become better at extracting energy at lower wind speeds and will continue to do so in the future. The cost of energy produced has gone down significantly. While still requiring subsidies it is now in the range of the commercial energy sources.

However none of these solve the basic problem, that some times the wind blow too little. So the wind is not our answer to our energy needs, but it has the potential to be part of the future energy mix, part of the answer.

Comments Off on A Guest Post By Troels Halken to Henk Tennekes’s Wind Power Guest Post

Filed under Guest Weblogs

Interesting Opinon Article By John Wallace of the University of Washington Which Significantly Broadens Out Environmenal Concerns Beyond Climate Change

There is an article in the Seattle Times on March 26 2010 by John Wallace of the Department of Atmospheric Science at the University of Washington [and thanks to Don Bishop to alerting us to it!] which reinforces the recommendations in our EOS article for a focus on a bottom-up emphasis on the vulnerability of key societal and environmental resources. This is in stark contrast to the  incorrectly narrowly focus in the IPCC reports on the use of the top-down multi-decadal global model projections of impacts to resources  due to their projections of climate change from the effects of added CO2 and a few other greenhouse gases.

Our EOS article is

Pielke Sr., R., K. Beven, G. Brasseur, J. Calvert, M. Chahine, R. Dickerson, D. Entekhabi, E. Foufoula-Georgiou, H. Gupta, V. Gupta, W. Krajewski, E. Philip Krider, W. K.M. Lau, J. McDonnell,  W. Rossow,  J. Schaake, J. Smith, S. Sorooshian,  and E. Wood, 2009: Climate change: The need to consider human forcings besides greenhouse gases. Eos, Vol. 90, No. 45, 10 November 2009, 413. Copyright (2009) American Geophysical Union

Our perspective is also discussed in Chapter E in

Kabat, P., Claussen, M., Dirmeyer, P.A., J.H.C. Gash, L. Bravo de Guenni, M. Meybeck, R.A. Pielke Sr., C.J. Vorosmarty, R.W.A. Hutjes, and S. Lutkemeier, Editors, 2004: Vegetation, water, humans and the climate: A new perspective on an interactive system. Springer, Berlin, Global Change – The IGBP Series, 566 pp.

[Chapter E can be downloaded from

Pielke, R.A. Sr. and L. Bravo de Guenni, Eds., 2004: How to evaluate vulnerability in changing environmental conditions. Part E In: Vegetation, Water, Humans and the Climate: A New Perspective on an Interactive System. Global Change – The IGBP Series, P. Kabat et al. Eds., Springer, 483-544.]

which provides more detail on this vulnerability perspective.

The Wallace article is titled

Beyond climate change: Reframing the dialogue over environmental issues

with the header

“Climate change is a serious concern, but society’s focus on it undermines critical efforts to address environmental degradation and sustainability in the broad sense. Climate scientists John M. Wallace urges the dialogue over environmental issues to be reframed to better address all environmental issues

The article reads

By John M. Wallace

Special to The Times

TRAVELING in India the past two months has impressed on me the breadth and urgency of the world’s environmental crisis. After decades of sustained growth following the “green revolution” in the 1960s, Indian crop yields no longer keep up with population growth.

Topsoil is becoming depleted of natural chemical nutrients so that increasing applications of chemical fertilizers are required to sustain high crop yields. Cropland is being lost to urbanization and topsoil is being stripped from fields to make bricks. Excess nitrogen from fertilizers in the runoff is polluting rivers and wetlands. Water tables are plummeting in response to shortsighted management practices such as “water mining” from deep wells to increase yields of dry-season crops.

Some highly regarded Indian ecologists are concerned about the risk of future biodiversity losses because of the introduction of genetically engineered plant species. India’s tiger population is reportedly down to about 1,400. People are sickened by toxic waste from factories producing goods for consumption in developed countries. The list goes on.

Media coverage of India’s looming environmental crisis has been eclipsed by the debate about long-term future impacts of global climate change. The revelation that the Himalayan glaciers are not retreating as rapidly as reported in the Fourth Assessment Report of the United Nations’ Intergovernmental Panel on Climate Change (IPCC) has been front-page news in India day after day. Readers of these news stories could easily come away with the impression that the immediacy of the environmental crisis has been exaggerated when, in fact, it is not being given sufficient emphasis.

It’s tempting to blame the media for fixating on global warming, but we climate scientists are partly to blame for the misplaced emphasis. Over the past 20 years we have stood by and watched as governmental and nongovernmental organizations that deal with environmental issues became more and more narrowly focused on the long-term impacts of global warming.

Meanwhile, more imminent issues relating to the sustainability of our planet’s life-support system under the pressures of growing human population and the widening gap between rich and poor are not getting the attention they deserve.

By failing to foster creation of robust, broad-based advisory mechanisms, we have allowed the IPCC assessment reports to become the dominant vehicle for representing the views of the scientific community on a widening range of environmental issues. In the IPCC terminology, symptoms of environmental degradation, regardless of their cause, are labeled as impacts of climate change, and the societal response to them is framed in terms of mitigating and adapting to climate change.

Scientists still write papers and speak to the media about environmental concerns outside of the purview of the IPCC, but with so much of the world’s attention riveted on climate change there is a lack of institutional infrastructure for calling attention to other issues.

Labeling issues such as reduced agricultural productivity, loss of biodiversity, pollution and the looming shortage of fresh water as “impacts of global warming” leaves the public confused and susceptible to propaganda by groups who oppose environmental regulation of any kind. With the IPCC increasingly in the spotlight, the denialists can trivialize the entire environmental crisis simply by casting doubt on the scientific consensus on global warming.

Climate scientists and their detractors are slugging it out every day in blogs and editorial pages while legislative initiatives to get governments to address environmental and resource issues remain stalled, despite broad public support for them.

At the recent Copenhagen Summit, the nations of the world were reluctant to make binding agreements to reduce their production of greenhouse gases. Given the limited public understanding of the intricacies of climate science, the human tendency to be more concerned with current issues than with what the climate will be like 100 years from now, and the glaring inequities in per capita fossil fuel consumption between countries like the United States and those like India, justifying an enlightened energy policy on the basis of concerns about global warming is a tough sell.

The negotiations might have gone better had the justification been framed in terms of conserving the world’s dwindling oil reserves, stabilizing oil prices and promoting energy independence.

The current stalemate is likely to persist as long as scientists allow climate change to dominate the environmental policy agenda. In order to promote a more productive dialogue between scientists and policymakers, the discussion of adaptation and mitigation options in the policy arena needs to be reframed so that it addresses environmental degradation and sustainability in the broad sense, not just the impacts of climate change.

John Michael Wallace is a professor and former chairman of the Department of Atmospheric Sciences at the University of Washington and a former co-director of the university’s Program on the Environment.

Comments Off on Interesting Opinon Article By John Wallace of the University of Washington Which Significantly Broadens Out Environmenal Concerns Beyond Climate Change

Filed under Vulnerability Paradigm

Further Confirmation Of Hypothesis 2a In Pielke Et Al 2009

In our paper

Pielke Sr., R., K. Beven, G. Brasseur, J. Calvert, M. Chahine, R. Dickerson, D. Entekhabi, E. Foufoula-Georgiou, H. Gupta, V. Gupta, W. Krajewski, E. Philip Krider, W. K.M. Lau, J. McDonnell,  W. Rossow,  J. Schaake, J. Smith, S. Sorooshian,  and E. Wood, 2009: Climate change: The need to consider human forcings besides greenhouse gases. Eos, Vol. 90, No. 45, 10 November 2009, 413. Copyright (2009) American Geophysical Union

hypothesis 2a reads

Although the natural causes of climate variations and changes are undoubtedly important, the human influences are significant and involve a diverse range of first order climate forcings, including, but not limited to, the human input of carbon dioxide (CO2). Most, if not all, of these human influences on regional and global climate will continue to be of concern during the coming decades.

Hypothesis 2b [which is the IPCC perspective] is although the natural causes of climate variations and changes are undoubtedly important, the human influences are significant and are dominated by the emissions into the atmosphere of greenhouse gases, the most important of which is CO2. The adverse impact of these gases on regional and global climate constitutes the primary climate issue for the coming decades.

We further wrote that

We therefore conclude that hypothesis 2a is better supported than hypothesis 2b, which is a policy that focuses on modulating carbon emissions. Hypothesis 2b as a framework to mitigate climate change will neglect the diversity of other, important first- order human climate forcings that also can have adverse effects on the climate system. We urge that these other climate forcings should also be considered with respect to mitigation and adaptation policies.

and

“In addition to greenhouse gas emissions, other first order human climate forcings are important to understanding the future behavior of Earth’s climate. These forcings are spatially heterogeneous and include the effect of aerosols on clouds and associated precipitation [e.g., Rosenfeld et al., 2008], the influence of aerosol deposition (e.g., black carbon (soot) [Flanner et al. 2007] and reactive nitrogen
[Galloway et al., 2004]), and the role of changes in land use/land cover [e.g., Takata et al., 2009]. Among their effects is their role in altering atmospheric and ocean circulation features away from what they would be in the natural climate system [NRC, 2005]. As with CO2, the lengths of time that they affect the climate are estimated to be on multidecadal time scales and longer.”

UCAR has a press release of an upcoming article to appear in Science Express that further supports hypothesis 2a and refutes hypothesis 2b.

The UCAR press release is titled

Pollution from Asia circles globe at stratospheric heights

Excerpts from the news release read

The monsoon is one of the most powerful atmospheric circulation systems on the planet, and it happens to form right over a heavily polluted region,” says NCAR scientist William Randel, the lead author. “As a result, the monsoon provides a pathway for transporting pollutants up to the stratosphere.”

“Once in the stratosphere, the pollutants circulate around the globe for several years. Some eventually descend back into the lower atmosphere, while others break apart.”

“The study suggests that the impact of Asian pollutants on the stratosphere may increase in coming decades because of the growing industrial activity in China and other rapidly developing nations. In addition, climate change could alter the Asian monsoon, although it remains uncertain whether the result would be to strengthen or weaken vertical movements of air that transport pollutants into the stratosphere.”

Of course, these aerosols are part of climate change, but otherwise this article is quite correct in identifying yet another important human climate forcing beyond CO2 as well as emphasizing the importance of regional atmospheric circulations in the assessment of climate change. Clearly a global average surface temperature trend tells us nothing useful with respect to this climate effect.

Comments Off on Further Confirmation Of Hypothesis 2a In Pielke Et Al 2009

Filed under Climate Change Forcings & Feedbacks

Guest Post “A Simple Tool To Detect CO2 Background Levels” By Francis Massen

GUEST POST BY FRANCIS MASSEN

Biography of Francis Massen here.

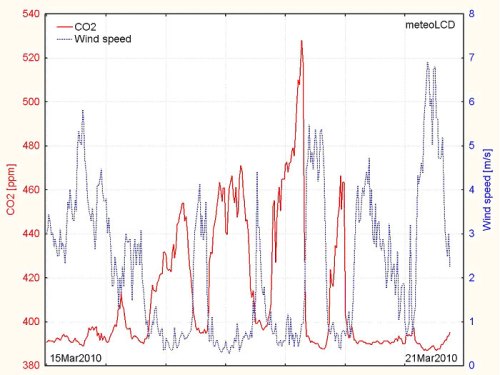
Atmospheric CO2 mixing ratios vary with latitude, regional specificities (as sea-side, continental or urban location) and time. Daily values may differ by more than 40%, as can be seen in the first figure showing CO2 and wind speed time series at the meteorological station “meteoLCD” in Diekirch, Luxembourg (semi-rural environment).


Figure 1: CO2 and wind speed values from 14 to 21 March 2010 in Diekirch, Luxembourg.

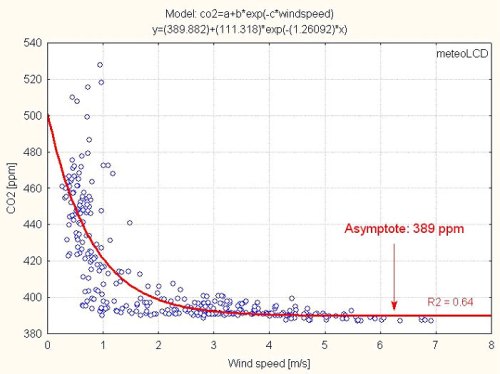
The causes of these hefty variations are many: magnitude of wind speed, periods of boundary layer inversions, changing plant behavior (photosynthetic CO2 absorption or CO2 emissions by plant respiration) and human activity. When the boundary layer is well mixed up, CO2 levels tend to a reproducible minimum, which represents the regional background level and may even be close to the published global mean CO2 mixing ratio. The mixing up of the near ground layer is essentially caused by the wind: a plot of CO2 versus wind speed often has a typical boomerang shape, as shown in the second figure.

Figure 2:  Plot of CO2 versus wind-speed using the values of Fig.1.

The background level can be thought as being the CO2 mixing ratio that would exist if wind speed was infinite. Simple visual inspection, or better, fitting the data to an exponential function of the type CO2 = a + b*exp(-c*windspeed) delivers this asymptotic CO2 level. In the example above, the model is statistically significant (R2 = 0.64) and suggests a regional background of 390 ppm (to be compared for instance to the 2009 seasonal corrected mean Mauna Loa level of approx. 388 ppm).

The CO2 versus wind speed plot can also be used as a first step to validate historic CO2 measurements, made by chemical methods. One example is the very careful measurements done from 1939 to 1940 by W. Kreutz in the town of Giessen, Germany. Kreutz used a chemical gas analyzer having an accuracy better than 1.5% and also recorded the wind speed. The exponential fit points to a very high asymptotic level of 398 ppm, well in excess to the consensus value of 310 ppm derived from the ice-cores.

This CO2 background problem is studied in a peer reviewed paper I presented with E. Beck as coauthor (Beck is a specialist of historical CO2 measurements) at the online conference Klima2009 organized in Nov. 2009 by the University of Applied Sciences of Hamburg, Germany. Our paper “Accurate estimation of CO2background level from near-ground measurements at non-mixed environments” was rewarded “Best Paper” among the 103 contributions. A slightly edited version will be published in an upcoming book “Social, Economic and Political Aspects of Climate Change” (editor: Prof. Walter Leal, Springer Verlag).

The text of the original Klima2009 paper can be found here

Comments Off on Guest Post “A Simple Tool To Detect CO2 Background Levels” By Francis Massen

Filed under Climate Change Forcings & Feedbacks, Guest Weblogs

Comment On The Article “Recovery Of Upper Ocean Heat From Major Volcanic Eruptions” By Heckendorn Et Al 2010

There is quite an informative article in the January 2010 issue of the SPARC [stratospheric processes and their role in climate] Newsletter. The article is

P. Heckendorn, F. Arfeuille, D. Weisenstein, S. Brönnimann, T. Peter, 2010 “SPARC Volcano Workshop 8-9 July 2009, Zurich, Switzerland” SPARC 2010 Newsletter no34 January.

I have two comments on this informative meeting summary

In  Section “Part IV: Radiative, chemical and dynamical response to volcanic eruptions”, there is the text

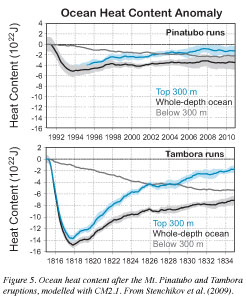
“G.Stenchikov showed with CM2.1, the recent GFDL coupled climate model (Delworth et al., 2006), that the accumulated averaged volcanic ocean heat content anomaly reaches about 1023 J, and offsets about 1/3 of the anthropogenic warming. After the Tambora and Mt. Pinatubo eruptions, the heat content below 300 m was reduced for decades (see Figure 5). Deep ocean temperature, sea level, salinity, and MOC (meridional overturning circulation) have a relaxation time of several decades to a century. This suggests that the Tambora subsurface temperature and sea level perturbations could have lasted well into the 20th century.”

This multi-decadal climate system memory to the radiative forcing of a volcanic eruption is quite an important conclusion. This would, of course, also apply to all other types of radiative forcing.  Climate prediction is clearly an initial value problem as I wrote about in

Pielke, R.A., 1998: Climate prediction as an initial value problem. Bull. Amer. Meteor. Soc., 79, 2743-2746. 

My second comment is with respect to the clear evidence of a negative radiative feedback (i.e. an adjustment back to a zero anomaly) when the volcanic eruptions produce a cooling radiative forcing (see the two figures below). This is clearly seen in the two figures below from the Stenchikov et al study reported on above. The obvious question is whether this negative feedback, for example, is due to changes in cloud cover in response to the volcanic emissions, and if such a feedback also operates when there is a warming radiative forcing. 


Comments Off on Comment On The Article “Recovery Of Upper Ocean Heat From Major Volcanic Eruptions” By Heckendorn Et Al 2010

Filed under Climate Change Forcings & Feedbacks

Comments on The Fox News Article By Joseph Abrams Titled “‘Archaic’ Network Provides Data Behind Global Warming Theory, Critics Say”

There was an interesting  news article on March 2 2010 titled

‘Archaic’ Network Provides Data Behind Global Warming Theory, Critics Say” By Joseph Abrams – FOXNews.com

It reads

“Crucial data on the American climate, part of the basis for proposed trillion-dollar global warming legislation, is churned out by a 120-year-old weather system that has remained mostly unchanged since Benjamin Harrison was in the White House. 

The network measures surface temperature by tallying paper reports sent in by snail mail from volunteers whose data, according to critics, often resembles a hodgepodge of guesswork, mathematical interpolation and simple human error.

“It’s rather archaic,” said Anthony Watts, a meteorologist who since 2007 has been cataloging problems in the 1,218 weather stations that make up the Historical Climatology Network.

“When the network was put together in 1892, it was mercury thermometers and paper forms. Today it’s still much the same,” he said.

The network relies on volunteers in the 48 contiguous states to take daily readings of high and low temperatures and precipitation measured by sensors they keep by their homes and offices. They deliver that information to the National Climatic Data Center (NCDC), which uses it to track changes in the climate.

Requirements aren’t very strict for volunteers: They need a modicum of training and decent vision in at least one eye to qualify. And they’re expected to take measurements seven days a week, 365 days a year.

That’s a recipe for trouble, says Watts, who told FoxNews.com that less scrupulous members of the network often fail to collect the data when they go on vacation or are sick. He said one volunteer filled in missing data with local weather reports from the newspapers that stacked up while he was out of town.

Click here to see a well-filled form | Click here to see a form missing data

And that’s just the tip of the iceberg. Volunteers take their readings at different times of day, then round the temperatures to the nearest whole number and mark down their measurements on paper forms they mail in monthly to the NCDC headquarters in Ashville, N.C.

“You’ve got this kind of a ragtag network that’s reporting the numbers for our official climate readings,” said Watts, who found that 90 percent of the stations violated the government’s guidelines for where they may be located.

Watts believes that poor placement of temperature sensors has compromised the system’s data. Though they are supposed to be situated in empty clearings, many of the stations are potentially corrupted by their proximity to heat sources, including exhaust pipes, trash-burning barrels, chimneys, barbecue grills, seas of asphalt — and even a grave.

Once the data reaches the NCDC, climate scientists in Ashville digitize the numbers and check to make sure there are no large anomalies. The introduction of electronic weather gauges into the system in the 1980s was a much-needed update, but the new and improved gauges measure temperatures slightly differently and must be corrected to sync up with the overall historic data.

If numbers appear faulty or if more than nine days are missing from a single month’s tally, the whole month is thrown out, according to NCDC documents, and the Center uses a computer program to determine average temperatures at dozens of nearby stations to guess what the temperature would have been for the month at the unknown station.

The overall land temperature record produced by the NCDC is used by a number of top climate research centers, including the U.N.’s International Panel on Climate Change, NASA’s Goddard Institute for Space Studies, and the Climatic Research Unit at the University of East Anglia, headed until recently by Phil Jones, who stepped down in the wake of the Climate-gate scandal.

What it boils down to, Watts says, is that some of the world’s top climate scientists have been crunching numbers that were altered by their immediate surroundings, rounded by volunteers, guessed at by the NCDC if there was insufficient data, then further adjusted to correct for “biases,” including the uneven times of day when measurements were taken — all ending up with a number that is 0.6 degrees warmer than the raw data, which Watts believes is itself suspect.

But scientists at the NCDC say the system is an indispensable tool for measuring local temperatures, and that its readings are buttressed by the consensus drawn from the 8,000 surface stations that make up the Cooperative Observer Program, the overall national system of which the 1,218 stations in the Historical Climatology Network are just a part.

“We use the rest of the COOP network to help calibrate,” said Jay Lawrimore, chief of the climate monitoring branch at NCDC. “It’s used to do quality control.”

NCDC climatologists carefully track temperature trends at local levels to ensure that the data submitted by volunteers is reliable, adjusting for the biases caused by the time of day when measurements are taken, for differences between old and new equipment, and to account for flukes that might be caused by poor siting.

The NCDC insists its adjusted numbers are an accurate representation of climatic reality, backed up by worldwide trends in air temperature, water temperature, glacier melt, plant flowering and other indicators of climate change.

“The signal appears to be robust, a reliable temperature signal,” said Lawrimore.

But Watts says that even a single step — the rounding of the daily temperature — creates a margin of error about as large as the entire global warming trend scientists are hoping to confirm.

It all could become moot within a decade, as the climate center’s outmoded Pony Express is currently being replaced with a screaming bullet train.

Lawrimore told FoxNews.com that about 5 percent of the historical network has already been automated, but a far more important development has been the launching of the digitally run Climate Reference Network (CRN), a system of 114 stations that went fully online in 2008.

The CRN was carefully sited in fields around the country and automatically records daily climate data and transmits it at midnight local time, sending it by satellite and eliminating the snail-mail delay, the rounding of numbers and any elements of human error.

But that doesn’t mean the Historical Climate Network is going away, say NCDC scientists, who will continue to rely on its volunteers’ readings to gather climate data on the local level.

So don’t stable those ponies just yet.

My comment on this informative article is with respect to the statement by Jay Lawrimore that

The signal [from the cooperative observer site that has existed for over 100 years] appears to be robust, a reliable temperature signal,” said Lawrimore.

If this were true, there would be no need for the new Climate Reference Network! I challenged Tom Karl with this several years ago but he had no answer. The reality is that the introduction of the Climate Reference Network is tacit recognition that there are major problems with using the existing NCDC network to assess multi-decadal surface temperature trends. This supports Anthony Watt’s findings that are reported in this news article.

Comments Off on Comments on The Fox News Article By Joseph Abrams Titled “‘Archaic’ Network Provides Data Behind Global Warming Theory, Critics Say”

Filed under Climate Change Metrics, Climate Science Reporting

A Comment On Judith Curry’s Interview In Discovery Magazine

There is an informative interview of Judith Curry in Discovery Magazine titled

Discover Interview It’s Gettin’ Hot in Here: The Big Battle Over Climate Science  [thanks to Bill DiPuccio for alerting us to the section I have highlighted below]

In Judy’s thoughtful interview responses she said

QUESTION: You’ve talked about potential distortions of temperature measurements from natural temperature cycles in the Atlantic and Pacific oceans, and from changes in the way land is used. How does that work?

JUDITH CURRY’S ANSWER: Land use changes the temperature quite a bit in complex ways—everything from cutting down forests or changing agriculture to building up cities and creating air pollution. All of these have big impacts on regional surface temperature, which isn’t always accounted for adequately, in my opinion. The other issue is these big ocean oscillations, like the Atlantic Multidecadal Oscillation and the Pacific Decadal Oscillation, and particularly, how these influenced temperatures in the latter half of the 20th century. I think there was a big bump at the end of the 20th century, especially starting in the mid-1990s. We got a big bump from going into the warm phase of the Atlantic Multidecadal Oscillation. The Pacific Decadal Oscillation was warm until about 2002. Now we’re in the cool phase. This is probably why we’ve seen a leveling-off [of global average temperatures] in the past five or so years. My point is that at the end of the 1980s and in the ’90s, both of the ocean oscillations were chiming in together to give some extra warmth.

Judy’s reply reinforces that we need a broader perspective on the climate issue, as we emphasized in

Pielke Sr., R., K. Beven, G. Brasseur, J. Calvert, M. Chahine, R. Dickerson, D. Entekhabi, E. Foufoula-Georgiou, H. Gupta, V. Gupta, W. Krajewski, E. Philip Krider, W. K.M. Lau, J. McDonnell,  W. Rossow,  J. Schaake, J. Smith, S. Sorooshian,  and E. Wood, 2009: Climate change: The need to consider human forcings besides greenhouse gases. Eos, Vol. 90, No. 45, 10 November 2009, 413. Copyright (2009) American Geophysical Union.

This includes both the need to include land use/and cover change as a first order human climate forcing and the more significant role of natural atmospheric/ocean circulations in modulating the climate system.

Comments Off on A Comment On Judith Curry’s Interview In Discovery Magazine

Filed under Climate Change Forcings & Feedbacks, Interviews