Monthly Archives: September 2012

Comment On “A National Strategy for Advancing Climate Modeling” From The NRC

There is a new and, in my view, scientifically flawed report published by the National Research Council. The report is

 A National Strategy for Advancing Climate Modeling

I have a few comments on this report in my post today which document its failings. First, the overarching perspective of the authors of the NRC report is [highlight added]

As climate change has pushed climate patterns outside of historic norms, the need for detailed projections is growing across all sectors, including agriculture, insurance, and emergency preparedness planning. A National Strategy for Advancing Climate Modeling emphasizes the needs for climate models to evolve substantially in order to deliver climate projections at the scale and level of detail desired by decision makers, this report finds. Despite much recent progress in developing reliable climate models, there are still efficiencies to be gained across the large and diverse U.S. climate modeling community.

My Comment:

First, their statement that “….climate change has pushed climate patterns outside of historic norms” is quite a convoluted statement. Climate has always been changing. This insertion of “climate change” clearly is a misuse of the terminology “climate change” as I discussed in the post

The Need For Precise Definitions In Climate Science – The Misuse Of The Terminology “Climate Change”

Second, there are no reliable climate model predictions on multi-decadal time scale! This is clearly documented in the posts; e.g. see

Comments On The Nature Article “Afternoon Rain More Likely Over Drier Soils” By Taylor Et Al 2012 – More Rocking Of The IPCC Boat

More CMIP5 Regional Model Shortcomings

CMIP5 Climate Model Runs – A Scientifically Flawed Approach

The NRC Report also writes

Over the next several decades, climate change and its myriad consequences will be further unfolding and possibly accelerating, increasing the demand for climate information. Society will need to respond and adapt to impacts, such as sea level rise, a seasonally ice-free Arctic, and large-scale ecosystem changes. Historical records are no longer likely to be reliable predictors of future events; climate change will affect the likelihood and severity of extreme weather and climate events, which are a leading cause of economic and human losses with total losses in the hundreds of billions of dollars over the past few decades.

My Comment:

As I wrote earlier in this post, the multi-decadal climate model predictions have failed to skillfully predict not only changes in climate statistics over the past few decades, but cannot even accurately enough simulate the time averaged regional climates! Moreover, in terms of the comment that

“…climate change will affect the likelihood and severity of extreme weather and climate events, which are a leading cause of economic and human losses with total losses in the hundreds of billions of dollars over the past few decades.”

this is yet another example of where the BS meter is sounding off! See, for example, my son’s most recent discussion of this failing by the this climate community;

The IPCC sinks to a new low

The NRC report continues

Computer models that simulate the climate are an integral part of providing climate information, in particular for future changes in the climate. Overall, climate modeling has made enormous progress in the past several decades, but meeting the information needs of users will require further advances in the coming decades.

They also write that

Climate models skillfully reproduce important, global-to-continental-scale features of the present climate, including the simulated seasonal-mean surface air temperature (within 3°C of observed (IPCC, 2007c), compared to an annual cycle that can exceed 50°C in places), the simulated seasonal-mean precipitation (typical errors are 50% or less on regional scales of 1000 km or larger that are well resolved by these models [Pincus et al., 2008]), and representations of major climate features such as major ocean current systems like the Gulf Stream (IPCC, 2007c) or the swings in Pacific sea-surface temperature, winds and rainfall associated with El Niño (AchutaRao and Sperber, 2006; Neale et al., 2008). Climate modeling also delivers useful forecasts for some phenomena from a month to several seasons ahead, such as seasonal flood risks.

My Comment:  Actually “climate modeling” has made little progress in simulating regional climate on multi-decadal time scales, and no demonstrated evidence of being able to skillfully predict changes in the climate system. Indeed, the most robust work are the peer-reviewed papers that are in my posts (as I also listed earlier in this post)

Comments On The Nature Article “Afternoon Rain More Likely Over Drier Soils” By Taylor Et Al 2012 – More Rocking Of The IPCC Boat

More CMIP5 Regional Model Shortcomings

CMIP5 Climate Model Runs – A Scientifically Flawed Approach

which document the lack of skill in the models.

The report also defines “climate” as

Climate is conventionally defined as the long-term statistics of the weather (e.g., temperature, precipitation, and other meteorological conditions) that characteristically prevail in a particular region.

Readers of my weblog should know that this is an inappropriately narrow definition of climate. In the NRC report

National Research Council, 2005: Radiative forcing of climate change: Expanding the concept and addressing uncertainties. Committee on Radiative Forcing Effects on Climate Change, Climate Research Committee, Board on Atmospheric Sciences and Climate, Division on Earth and Life Studies, The National Academies Press, Washington, D.C., 208 pp.

(which the new NRC report conveniently ignored), climate is defined as

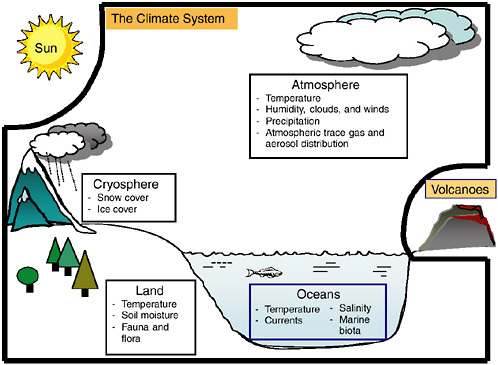
The system consisting of the atmosphere, hydrosphere, lithosphere, and  biosphere, determining the Earth’s climate as the result of mutual interactions  and responses to external influences (forcing). Physical, chemical, and  biological processes are involved in interactions among the components of the  climate system.

FIGURE 1-1 The climate system, consisting of the atmosphere, oceans, land, and cryosphere. Important state variables for each sphere of the climate system are listed in the boxes. For the purposes of this report, the Sun, volcanic emissions, and human-caused emissions of greenhouse gases and changes to the land surface are considered external to the climate system (from NRC, 2005)

This new NRC report “A National Strategy for Advancing Climate Modeling” misrepresents the capabilities of the climate models to simulate the climate system on multi-decadal time periods.

While I am in support of studies that assess the predictability skill of the models and to use them for monthly and seasonal predictions (which can be quickly tested against observations), seeking to advance climate modeling by claiming that more accurate multi-decadal regional forecasts can be made for policymakers and impact scientists and engineer with their proposed approach is, in my view, a dishonest communication to policymakers and to the public.

This need for advanced climate modeling should be promoted only and specifically with respect to assessing predictability on monthly,seasonal and longer time scales, not to making multi-decadal predictions for the impacts communties.

Comments Off on Comment On “A National Strategy for Advancing Climate Modeling” From The NRC

Filed under Climate Science Misconceptions, Climate Science Reporting

My Twitter Account

I have decided to enter the Twitter world. My twitter name is @RogerAPielkeSr. I look forward using this medium of communication. I will occasionally present on Twitter as I learn how to best use it.

Comments Off on My Twitter Account

Filed under Twitter

E-Mail To Linda Mearns On The 2012 BAMS Article On Dynamic Downscaling

source of image from Linda Mearns website

With respect to my post

“The North American Regional Climate Change Assessment Program: Overview of Phase I Results” By Mearns Et Al 2012 – An Excellent Study But It Overstates Its Significance In The Multi-Decadal Prediction Of Climate

I have sent the lead author, Linda Mearns, the e-mail below [and copied to her other co-authors and to several other colleagues who work on downscaling]. I will post her reply, if I receive one and have her permission.

Subject: Your Septmeber 2012 BAMS

Hi Linda

I read with considerable interest your paper

Linda O. Mearns, Ray Arritt, Sébastien Biner, Melissa S. Bukovsky, Seth McGinnis, Stephan Sain, Daniel Caya, James Correia, Jr., Dave Flory, William Gutowski, Eugene S. Takle, Richard Jones, Ruby Leung, Wilfran Moufouma-Okia, Larry McDaniel, Ana M. B. Nunes, Yun Qian, John Roads, Lisa Sloan, Mark Snyder, 2012: The North American Regional Climate Change Assessment Program: Overview of Phase I Results. Bull. Amer.Met Soc. September issue. pp 1337-1362.

It is a very much needed, effective analysis of the level of regional dynamic downscaling skill when forced by reanalyses. In

Castro, C.L., R.A. Pielke Sr., and G. Leoncini, 2005: Dynamical downscaling: Assessment of value retained and added using the Regional Atmospheric Modeling System (RAMS). J. Geophys. Res. – Atmospheres, 110, No. D5, D05108, doi:10.1029/2004JD004721.

and summarized in

Pielke Sr., R.A., and R.L. Wilby, 2012: Regional climate downscaling . what’s the point? Eos Forum, 93, No. 5, 52-53, doi:10.1029/2012EO050008.

Pielke, R. A., Sr., R. Wilby,  D. Niyogi, F. Hossain, K. Dairuku,J. Adegoke, G. Kallos, T. Seastedt, and K. Suding (2012), Dealing with complexity and extreme events using a bottom-up, resource-based vulnerability perspective, in Extreme Events and Natural Hazards: The Complexity Perspective, Geophys. Monogr. Ser., vol. 196, edited by A. S. Sharma et al. 345.359, AGU, Washington, D. C., doi:10.1029/2011GM001086. [copy available from https://pielkeclimatesci.files.wordpress.com/2011/05/r-365.pdf]

you are evaluating the skill and value-added of Type 2 downscaling.

However, you are misleading the impacts communities by indicating that your results apply to regional climate change (i.e. Type 4 downscaling).

I have posted on my weblog today

“The North American Regional Climate Change Assessment Program: Overview of Phase I Results” By Mearns Et Al 2012 – An Excellent Study But It Overstates Its Significance In The Multi-Decadal Prediction Of Climate

which is critical of how you present the implications of your findings.

As you wrote at the end

The Mearns et al 2012 study concludes with the claim that

“Our goal was to provide an overview of the relative performances of the six models both individually and as an ensemble with regard to temperature and precipitation. We have shown that all the models can simulate aspects of climate well, implying that they all can provide useful information about climate change. In particular, the results from phase I of NARCCAP will be used to establish uncertainty due to boundary conditions as well as final weighting of the models for the development of regional probabilities of climate change.”

You write

“We have shown that all the models can simulate aspects of climate well, implying that they all can provide useful information about climate change.”

What you have actually accomplished (and it is significant) is document the upper bound in terms of simulation skill of value-added to reanalyses using dynamic downscaling. However, you have not shown how this study provides skillful information in terms of changes in regional climate statistics on multi-decadal time scales.

I would like to post on my weblog a response from you (and your co-authors if they would like to) that responds to my comments. I will also post this e-mail query.

I have also copied this e-mail to other of our colleagues who are working on dynamic downscaling.

With Best Regards

Roger

Comments Off on E-Mail To Linda Mearns On The 2012 BAMS Article On Dynamic Downscaling

Filed under Climate Models, Research Papers

New Survey On Climate Science By Bart Verheggen, Bart Strengers, Rob van Dorland, And John Cook

UPDATE: I received the e-mail below from Bart clarifying the survey.

Hi Roger,

These are the survey questions that we distributed earlier this year (april), ie this is not an active survey at this moment.

We will communicate the survey results at a later stage.

Regards, Bart

Dr Bart Verheggen Scientist Netherlands Environmental Assessment Agency PBL

Department of Climate, Air and Energy

Bilthoven, The Netherlands

*****************************************

I received the e-mail below with respect to a climate survey.

Date: Wed, 26 Sep 2012 08:45:15 +0000
From: “Verheggen, Bart”
To: “Verheggen, Bart”
Cc: “Strengers, Bart”
Subject: Survey questions available on PBL website

Dear survey respondent,

Based on requests we received, we hereby make the Climate Science Survey questions and answer options available on the PBL website:

http://www.pbl.nl/en/news/newsitems/2012/survey-on-the-opinions-on-climate-change

With kind regards,
Bart Verheggen, Bart Strengers, Rob van Dorland, John Cook

Regards,

Dr Bart Verheggen
Scientist

………………………………………………………………
Department of Climate, Air and Energy
PBL Netherlands Environmental Assessment Agency
Ant. van Leeuwenhoeklaan 9 | 3721 MA | Bilthoven | W.340
PO box 303 | 3720 AH | Bilthoven

Issues related to the role of climate science in society will also receive attention. The results and their analysis will be published on our website and submitted to a scientific journal. We anticipate this study to facilitate a constructive dialogue on the selected issues, between people of different opinion, and to help communicate these issues to a wider audience.

See also:

The questions asked in the survey (PDF, 403 KB)

More information

For further information, please contact the PBL press office (+31 70 3288688 or persvoorlichting@pbl.nl).

The summary of the survey is given in

Survey on the opinions on climate change

which reads

Newsitem | 22-03-2012

PBL Netherlands Environmental Assessment Agency, in conjunction with the Royal Dutch Meteorological Institute (KNMI) and the University of Queensland (Australia), is investigating the range of scientific opinions about climate change. The objective of this study is to gain insight into how climate scientists perceive the public debate on the physical scientific aspects of climate change.

To this end, an international survey is being held among scientists who have published about global warming. Also invited are people who publicly have raised criticisms against climate science. Survey responses remain anonymous.

Physical scientific aspects of climate change are a focal point in the public debate. Therefore, this survey is focused on these ‘IPCC Working Group I’ topics, as they form the foundations for further deliberation; for example, regarding impacts or response strategies.

source of image

Comments Off on New Survey On Climate Science By Bart Verheggen, Bart Strengers, Rob van Dorland, And John Cook

Filed under Climate Surveys

My Comment On “A Closer Look At Why The Climate Change Debate Is So Polarized” By Keith L. Seitter

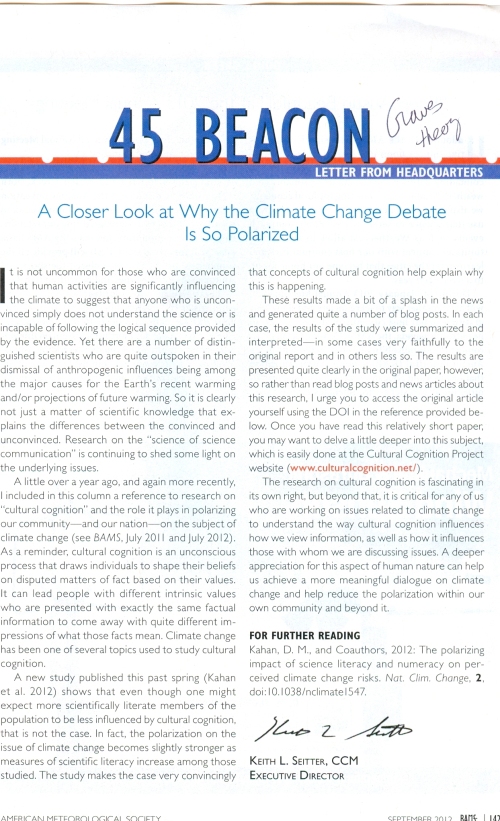
There is an interesting write-up in the September 2012 issue of BAMS titled

A Closer Look at Why the Climate Change Debate Is So Polarized [unfortunately, there is no url for it except for AMS members, but I have reproduced below].

This article by Keith L. Seitter, Executive Director of the AMS, is an important reaching out to the climate science community. His statement that [highlight added]

“It is not uncommon for those who are convinced that human activities are significantly influencing the climate to suggest that anyone who is unconvinced simply does not understand the science or is incapable of following the logical sequence provided by the evidence. Yet there are a number of distinguished scientists who are quite outspoken in their dismissal of anthropogenic influences being among the major causes for the Earth’s recent warming and/or projections of future warming.”

This reaching out to those who do not accept statements such as recently promulgated by the AMS; i.e.

Climate Change

is a refreshing recognition of the actual diversity of viewpoints in this professional society.

While I accept that human activity has played a significant role in altering the Earth’s climate system (including its heating), I welcome the recognition that those who do not agree with some or all of this statement are still respected. We need more such reaching out by all viewpoints in the climate issue.

In terms of the context of the “cultural issues” that Keith discusses, I recommend they also be considered in the context of Graves Value Theory. This concept categorizes individuals into what someone finds important; e. g. see

Graves’ value theory

In this theory, as discussed in the above link

Graves theorized that there are eight value systems which evolved over the course of the past 100,000 years of human history. This evolutionary process has affected us biologically, psychologically and culturally.

Graves formulated the following starting points for his value system:

  • Each fundamental value system is the result, on the one hand, of someone’s circumstances and the problems that come with it (life conditions), and on the other hand of the way he deals with it based on his neurological ‘wiring’ (mind conditions).
  • Every adult contains all value systems within himself.
  • A person’s value system changes depending on the circumstances he finds himself in.
  • The development of value systems is like a pendulum, moving back and forth between value systems focused on the individual and those focused on the collective.
  • The more complex people’s circumstances, the more complex the value systems which are required.
  • Value systems depend on the context. In different contexts (family, work, etc.) people may experience their immediate environment in a different way. This means that different value systems may predominate in these different contexts.

I am certainly not an expert on this topic, but recommend those who are to pursue this line of research in the context, as Keith presents of

cultural cognition and the role it plays in polarizing the our community – and our nation –  on the subject of climate change.”

Thanks to Keith Seitter for seeking to broaden the climate discussion!

Comments Off on My Comment On “A Closer Look At Why The Climate Change Debate Is So Polarized” By Keith L. Seitter

Filed under Climate Science Op-Eds

“The North American Regional Climate Change Assessment Program: Overview of Phase I Results” By Mearns Et Al 2012 – An Excellent Study But It Overstates Its Significance In The Multi-Decadal Prediction Of Climate

There is a new paper

Linda O. Mearns, Ray Arritt, Sébastien Biner, Melissa S. Bukovsky, Seth McGinnis, Stephan Sain, Daniel Caya, James Correia, Jr., Dave Flory, William Gutowski, Eugene S. Takle, Richard Jones, Ruby Leung, Wilfran Moufouma-Okia, Larry McDaniel, Ana M. B. Nunes, Yun Qian, John Roads, Lisa Sloan, Mark Snyder, 2012: The North American Regional Climate Change Assessment Program: Overview of Phase I Results. Bull. Amer.Met Soc. September issue. pp 1337-1362.

that provides further documentation of the level of skill of dynamic downscaling. It is a very important new contribution which will be widely cited. The participants in the North American Regional Climate Change Assessment Program  are listed here.

However, it significantly overstates the significance of its findings in terms of its application to the multi-decadal prediction of regional climate.

The paper is even highlighted on the cover of the September 2012 issue of BAMS, with the caption for the cover in the Table of Contents that reads

“Regional models are the foundation of research and services as planning for climate change requires more specific information than can be provided by global models. The North American Regional Climate Change Assessment Programs (Mearns et al., page 1337) evaluates uncertainties in using such models….”

Actually, as outlined below, the Mearns et al 2012 paper, while providing valuable new insight into one type of regional dynamic downscaling, is misrepresenting what these models can skillfully provide with respect to “climate change”.

The study uses observational data (from a Reanalysis) to drive the regional models. Using the classification we have introduced in our papers (see below), this is a type 2 dynamic downscaling study.

The Mearns et al 2012 paper only provides an upper bound of what is possible with respect to their goal to provide

uncertainties in regional scale projections of future climate and produce high resolution climate change scenarios using multiple regional climate models (RCMs) nested within atmosphere ocean general circulation models (AOGCMs) forced with the A2 SRES scenario.”

The type of downscaling used in a study is a critically important point that needs to be emphasized when dynamic downscaling studies are presented.  Indeed, the new paper seeks to just replicate the current climate, NOT changes in climate statistics over the time period of the model runs.

It is even more challenging to skillfully predict CHANGES in regional climate which is what is required if the RCMs are to add any value for predicting climate in the coming decades.

The abstract and their short capsule reads [highlight added]

The North American Regional Climate Change Assessment Program is an international effort designed to investigate the uncertainties in regional scale projections of future climate and produce high resolution climate change scenarios using multiple regional climate models (RCMs) nested within atmosphere ocean general circulation models (AOGCMs) forced with the A2 SRES scenario, with a common domain covering the conterminous US, northern Mexico, and most of Canada. The program also includes an evaluation component (Phase I) wherein the participating RCMs, with a grid spacing 50 km, are nested within 25 years of NCEP/DOE global reanalysis II.

We provide an overview of our evaluations of the Phase I domain-wide simulations focusing on monthly and seasonal temperature and precipitation, as well as more detailed investigation of four sub-regions. We determine the overall quality of the simulations, comparing the model performances with each other as well as with other regional model evaluations over North America.  The metrics we use do differentiate among the models, but, as found in previous studies, it is not possible to determine a ‘best’ model among them. The ensemble average of the six models does not perform best for all measures, as has been reported in a number of global climate model studies. The subset ensemble of the 2 models using spectral nudging is more often successful for domain wide root mean square error (RMSE), especially for temperature. This evaluation phase of NARCCAP will inform later program elements concerning differentially weighting the models for use in producing robust regional probabilities of future climate change.

Capsule

This article presents overview results and comparisons with observations for temperature and precipitation from the six regional climate models used in NARCCAP driven by NCEP/DOE Reanalysis II (R2) boundary conditions for 1980 through 2004.

Using the types of dynamic downscaling that we present in the articles

Castro, C.L., R.A. Pielke Sr., and G. Leoncini, 2005: Dynamical downscaling:  Assessment of value retained and added using the Regional Atmospheric  Modeling System (RAMS). J. Geophys. Res. – Atmospheres, 110, No. D5, D05108,  doi:10.1029/2004JD004721.

Pielke Sr., R.A., and R.L. Wilby, 2012: Regional climate downscaling – what’s the point? Eos Forum,  93, No. 5, 52-53, doi:10.1029/2012EO050008.

the Mearns et al 2012 paper is a Type 2 downscaling. It provides an upper bound on the skill possible from Type 3 and Type 4 downscaling, since real world observations are used to constrain the model simulations (through the lateral boundary conditions, and from interior nudging if used).

These types of downscaling are defined in the Castro et al 2005 and Pielke and Wilby 2012 papers as

Type 1 downscaling is used for short-term, numerical weather prediction. In dynamic type 1 downscaling the regional model includes initial conditions from observations. In type 1 statistical downscaling the regression relationships are developed from observed data and the type 1 dynamic model predictions.

Type 2 dynamic downscaling refers to regional weather (or climate) simulations [e.g., Feser et al., 2011] in which the regional model’s initial atmospheric conditions are forgotten (i.e., the predictions do not depend on the specific initial conditions) but results still depend on the lateral boundary conditions from a global numerical weather prediction where initial observed atmospheric conditions are not yet forgotten or are from a global reanalysis. Type 2 statistical downscaling uses the regression relationships developed for type 1 statistical downscaling except that the input variables are from the type 2 weather (or climate) simulation. Downscaling from reanalysis products (type 2 downscaling) defines the maximum forecast skill that is achievable with type 3 and type 4 downscaling.

Type 3 dynamic downscaling takes lateral boundary conditions from a global model prediction forced by specified real world surface boundary conditions such as seasonal weather predictions based on observed sea surface temperatures, but the initial observed atmospheric conditions in the global model are forgotten [e.g., Castro et al., 2007]. Type 3 statistical downscaling uses the regression relationships developed for type 1 statistical downscaling except using the variables from the global model prediction forced by specified real-world surface boundary conditions.

Type 4 dynamic downscaling takes lateral boundary conditions from an Earth system model in which coupled interactions among the atmosphere, ocean, biosphere, and cryosphere are predicted [e.g., Solomon et al.,
2007]. Other than terrain, all other components of the climate system are calculated by the model except for human forcings, including greenhouse gas emissions scenarios, which are prescribed. Type 4 dynamic
downscaling is widely used to provide policy makers with impacts from climate decades into the future. Type 4 statistical downscaling uses transfer functions developed for the present climate, fed with large scale atmospheric information taken from Earth system models representing future climate conditions. It is assumed that statistical relationships between real-world surface observations and large-scale weather patterns will not change. Type 4 downscaling has practical value but with the very important caveat that it should be used for model sensitivity experiments and not as predictions [e.g., Pielke, 2002; Prudhomme et al., 2010].

Because real-world observational constraints diminish from type 1 to type 4 downscaling, uncertainty grows as more climate variables must be predicted by models, rather than obtained from observations.

The Mearns et al 2012 study concludes with the claim that

Our goal was to provide an overview of the relative performances of the six models both individually and as an ensemble with regard to temperature and precipitation. We have shown that all the models can simulate aspects of climate well, implying that they all can provide useful information about climate change. In particular, the results from phase I of NARCCAP will be used to establish uncertainty due to boundary conditions as well as final weighting of the models for the development of regional probabilities of climate change.

First, as documented in the article, the difference between  the models and the observations are actually significant. To claim that

“all the models can simulate aspects of climate well”

is not a robust claim.  What is meant by “well”?  The tables and figures in the article document significant biases in the temperatures and precipitation even for the current climate type 2 downscaling simulations.

Even more significantly, their type 2 downscaling study does NOT imply

“that they all can provide useful information about climate change”!

The  Mearns et al 2012 study did not look at the issue of their skill to predict CHANGES in climate statistics. For this they must examine type 4 downscaling skill, which they did not do.

In the context of the skill achieved with type 2 dynamic downscaling, this is an important, useful study.  However, to use the results of this type 2 downscaling study by Mearns et al 2012 to provide

“….final weighting of the models for the development of regional probabilities of climate change”

is a gross overstatement of what they accomplished. One cannot use type 2 downscaling to make claims about the accuracy of type 4 downscaling.

I am e-mailing the authors of the Mearns et al 2012 paper to request their response to my comments.  Each of them are well-respected colleagues and I will post their replies when they respond.

source of image

Comments Off on “The North American Regional Climate Change Assessment Program: Overview of Phase I Results” By Mearns Et Al 2012 – An Excellent Study But It Overstates Its Significance In The Multi-Decadal Prediction Of Climate

Filed under Climate Models, Climate Science Misconceptions, Research Papers

A PBS Overreaction

Judy Curry has an excellent post titled

PBS Ombudsman

on her weblog with respect to the response of the PBS Ombudsman, Michael Getler to the appearance of Anthony Watts on PBS’s News Hour. I watched the interview where Anthony did an excellent and clearly articulated presentation of his views (and that of quite a few other climate scientists).

The interview adds to the debate on the climate issue, and those who complained to PBS, in my view, are seeking to suppress the public from seeing there is a diversity of viewpoints on climate from what they typically hear about in the media. The original PBS show was very well done.

Since Judy has already discussed Michael Getler’s response as Ombudsman , I just want to add one comment here.

In the statement by Michael Getler, he wrote

What was stunning to me as I watched this program is that the NewsHour and  Michels had picked Watts — who is a meteorologist and commentator — rather than  a university-accredited scientist to provide “balance.”

What in the world is “a university-accredited scientist?”

If this means that one has to be a faculty member at a University, this definition fails. For example, Alan Betts is an internationally well-respected scientist who has chosen to work by himself.  He  has not been a university faculty member for years.

Could the definition mean you must have a Ph.d? Clearly No. As just one example, Lew Grant, also an internationally well-respected scientist who was a Professor at Colorado State University, but does not have a Ph.d.

Update: I was alerted that Tom Karl, Director of NOAA’s NCDC also does not have a Ph.d.

Could it mean that you have to be a university professor that works in the area of study; in this case climate science. Also, the answer is No. Richard Muller has internationally well-respected credentials in physics, but he is a newcomer to climate science.

In contrast, Anthony Watts has been working in weather and climate for quite a few years, and is clearly well-qualified to discuss the surface temperature siting issues presented in the PBS broadcast. Even Tom Karl at NOAA’s NCDC invited Anthony to give a talk at their headquarters in Asheville several years ago.  Indeed, NCDC has made changes in their network specifically in response to Anthony’s pioneering work on station siting!

The PBS Ombudsman, Michael Getler, clearly has inappropriately reacted to what was a valuable, much-needed (and usually missing from PBS) report on the diversity of perspectives on the climate issue.

source of image

Comments Off on A PBS Overreaction

Filed under Climate Science Reporting

How the NSF allocates billions of federal dollars to top universities by Lee Drutman

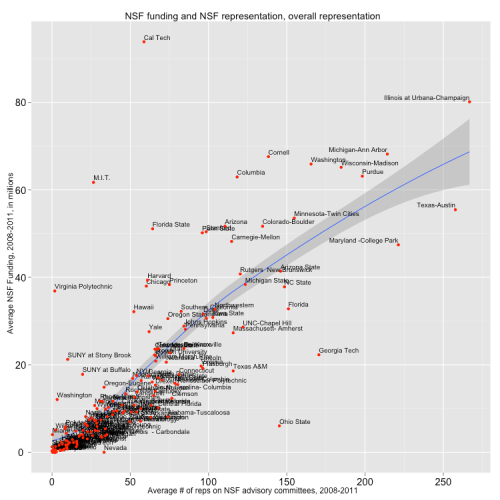
Figure 1 from the  Drutman article

There is an informative analysis of NSF funding in the article

How the NSF allocates billions of federal dollars to top universities by Lee Drutman

The article reads in part [highlight added]

As another college year begins, tens of thousands of academics will once again be scrambling to submit proposals to the National Science Foundation, hoping to secure government funding for their research. Each year, the National Science Foundation (NSF) bestows more than $7 billion worth of federal funding on about 12,000 research proposals, chosen out of about 45,000 submissions.

Thanks to the power of open data, we can now see how representation on NSF federal advisory committees connects to which universities get the most funding. (Federal advisory committee membership data is a feature of Influence Explorer.)

Our analysis finds a clear correlation between the universities with the most employees serving on the NSF advisory committees and the universities that receive the most federal money. Overall about 75% of NSF funding goes to academic institutions.

Even when controlling for other factors, we find that for each additional employee a university has serving on an NSF advisory committee that university can expect to see an additional $125,000 to $138,000 in NSF funding.

Although the 144 NSF advisory committees do not make funding decisions directly, they do “review and provide advice on program management, overall program balance, and other aspects of program performance,” according to the NSF.

At a big picture view, looking at the data on NSF grant awards and NSF advisory committee representation reinforces just how much of the money and representation is concentrated in a limited number of major universities.

Twenty percent of top research universities got 61.6% of the NSF funding going to top research universities between 2008 and 2011. These universities also had 47.9% of the representatives on NSF advisory committees who came from top research universities during the same period. The next 20% of universities got 21.9% of the funding, and had 25.7% of the representatives. The bottom 20% research universities had just 1.0% of the funding and have 2.4% of the representatives.

Just 23 universities account for more than half of the funding awarded by the NSF top to research universities. See Table 1 .

The University of California tops the list by far, because we combined all University of California campuses (due to data issues, see our data and methodology section), followed by Cal Tech, the University of Illinois, Michigan and Cornell. Interestingly, of the traditional top three universities (Harvard, Princeton and Yale), only Harvard shows up on the above list, at No. 22.

For complete data on 171 major research universities, click here. (The 171 universities come from the US News and World Report list of 200 major research universities. We selected only universities that had some interaction with the NSF between 2008 and 2011).

More representatives on advisory committees, more funding

Figure 1 plots the average NSF funding level for the university from 2008-2011, and the average number of representatives serving on NSF committees during this same period.

The correlation is clear. The more university-affiliated individuals serve on NSF advisory committees, the more NSF funding the university gets. Mostly, big state schools, with a few Ivy League schools in the mix, dominate the higher echelons of funding and representation. Interestingly, both Cal Tech and M.I.T., two of the pre-eminent research institutions in the country, get substantial NSF funding with limited representation. (Note: The University of California is left off this chart since it is a far outlier on both average funding ($361 million) and average representation (638.5 members). Because the quality of our data prevents us from breaking down the University of California by campus, we largely omit it from our analysis.)

A second scatterplot (Figure 2) examines the relationship between the number of committees and the funding levels. Here the data take on a slightly different relationship. With the exception of a few outliers, there is a changing relationship between the diversity of committees and the NSF funding levels.  It is more exponential than linear. Having representation on just a few committees doesn’t consistently correlate with higher funding, but having representation on a lot of committees is strongly correlated with higher funding.

Do more representatives help universities secure more funding?

The NSF “strives to conduct a fair, competitive, transparent, merit-review process for the selection of projects,” based on intellectual merit and broader impacts. Each year, the NSF produces an annual report on the merit review process. To make funding decisions, the NSF relies on tens of thousands of expert reviewers, though program officers make the final decisions.

Advisory committees oversee the general direction of the NSF program areas, including identifying “disciplinary needs and areas of opportunities.” As for who gets on these committees, the NSF explains that: “Many factors are weighed when formulating Committee membership, including the primary factors of expertise and qualifications, as well as other factors including diversity of institutions, regions, and groups underrepresented in science, technology, engineering, and mathematics.”

An example of such a committee is the Proposal Review Panel for Information and Intelligent Systems. Following the hyperlink provided would take you to a list of committee members in Influence Explorer, most of whom have university affiliations.

Showing that more representatives help universities get more funding than they would otherwise have received is difficult. There is a very good and reasonable explanation for the patterns we observe in the two above scatter plots: The NSF tries to get the most knowledgeable experts and accomplished academics to serve on its committees. Not surprisingly, the universities that attract the most NSF money are also likely to be home to many accomplished experts, since they are all leading research universities.

However, there are a few ways in which representatives could help their own universities to improve their chances. One possibility is that if a department has a representative on an NSF committee, that representative will be able to pass along funding opportunities and advice on navigating on the decision-making process of the committee to others in the university, thus strengthening others’ chances. Insiders can help others to better understand what a review committee might be looking for.

Another possibility is that in directing the general funding strategies of NSF program areas, advisory committees might see what their universities are doing as particularly valuable. Or more benignly, they might be more aware of the cutting-edge research within their universities just because it is being done by colleagues they interact with on a regular basis.

One way to investigate the relationship is to do a regression analysis, which allows us to control for different factors simultaneously. For those of a more technical mind, the details are below. For those who want the quick takeaway, it goes like this: Controlling for previous NSF funding and university endowment, universities with more NSF advisory committee representatives get more NSF funding than those that don’t. Each additional representative translates into about an extra $125,000 to $138,000 in NSF funding, controlling for other factors. The number of representatives is more important than the number of committees with representatives. Lobbying expenditures make no difference.

The entire article with the tables is very worth reading.

Comments Off on How the NSF allocates billions of federal dollars to top universities by Lee Drutman

Filed under Climate Proposal Review Process

Arctic Lower Tropospheric Temperature Trends Since 1979

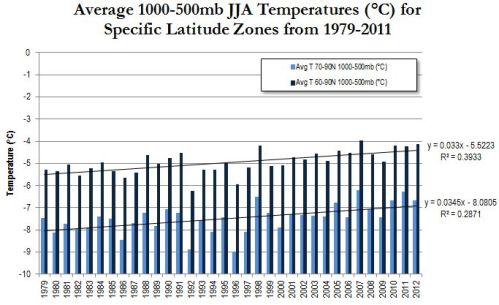
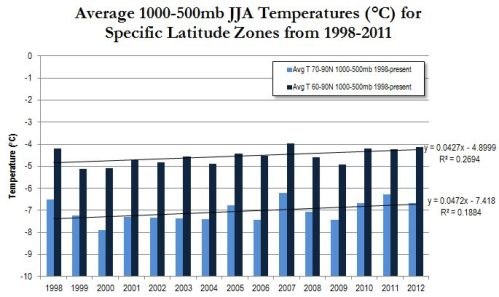
As part of a set of papers we are working on, Emily Gill of the University of Colorado has analyzed the NCEP/NCAR lower tropospheric temperature trends from latitude 60N and 70N to the North Pole for June,July and August. This is shown below for two time periods; the top figure from the time period when satellite coverage becames global and the bottom figure since the large ENSO event in 1998.

These plots are provided as part of the examination of the reasons for the greater sea ice melt in recent years, which I discussed in the post

Summary Of Arctic Ice Decline – Recommendations For Investigation Of The Cause(s)

These two figures address the issue raised in that post to perform

 “…analyses of lower tropospheric and surface temperature anomalies by season for the Arctic sea ice regions.”

It is clear there has been warming over the period of record. However, it is relatively small.  Using a linear regression, the June, July and August warming since 1979 was +1.0 C, and since 1998 +0.5 to +0.6 C in the region from 60N and from 70N North Pole. There is quite bit of interannual variability such that a linear trend does not explain a majority of the variations over this time period.

Emily Gill has also provided the global June, July and August analyses. The global linear regression change for 1979 to 2012 is +0.73C.  For the period 1998 to 2012 and for 1999 to 2012 the linear regression change is +0.43 C and +0.57 C, respectively (the different start years were to include the 1998 large positive value associated with the large ENSO event).  Interestingly, there is not much of an Arctic amplification of warming.

It is not clear how this modest lower tropospheric warming would have resulted in such large Arctic sea ice melting unless

i) the warmth was accompanied by less cloudiness than average,

and

ii) the sea ice was always very marginally close to melting.

Comments Off on Arctic Lower Tropospheric Temperature Trends Since 1979

Filed under Climate Change Metrics, Uncategorized

Our Chapter “Dealing with complexity and extreme events using a bottom-up, resource-based vulnerability perspective” By Pielke Sr Et Al 2012 Has Appeared

Our article

Pielke, R. A., Sr., R. Wilby,  D. Niyogi, F. Hossain, K. Dairuku,J. Adegoke, G. Kallos, T. Seastedt, and K. Suding (2012), Dealing with complexity and extreme events using a bottom-up, resource-based vulnerability perspective, in Extreme Events and Natural Hazards: The Complexity Perspective, Geophys. Monogr. Ser., vol. 196, edited by A. S. Sharma et al. 345–359, AGU, Washington, D. C., doi:10.1029/2011GM001086. [the article can also be obtained from here]

has appeared in

Sharma, A. S.,A. Bunde, P. Dimri, and D. N. Baker (Eds.) (2012), Extreme Events and Natural Hazards: The Complexity Perspective, Geophys. Monogr. Ser., vol. 196, 371 pp., AGU, Washington, D. C., doi:10.1029/GM196.

The description of the book is given on the AGU site as [highlight added]

Extreme Events and Natural Hazards: The Complexity Perspective examines recent developments in complexity science that provide a new approach to understanding extreme events. This understanding is critical to the development of strategies for the prediction of natural hazards and mitigation of their adverse consequences. The volume is a comprehensive collection of current developments in the understanding of extreme events. The following critical areas are highlighted: understanding extreme events, natural hazard prediction and development of mitigation strategies, recent developments in complexity science, global change and how it relates to extreme events, and policy sciences and perspective. With its overarching theme, Extreme Events and Natural Hazards will be of interest and relevance to scientists interested in nonlinear geophysics, natural hazards, atmospheric science, hydrology, oceanography, tectonics, and space weather.

The abstract of our article reads

“We discuss the adoption of a bottom-up, resource–based vulnerability approach in evaluating the effect of climate and other environmental and societal threats to societally critical resources.This vulnerability concept requires the determination of the major threats to local and regional water, food, energy, human health, and ecosystem function resources from extreme events including climate, but also from other social and environmental issues. After these threats are identified for each resource, then the relative risks can be compared with other risks in order to adopt optimal preferred mitigation/adaptation strategies.

This is a more inclusive way of assessing risks, including from climate variability and climate change than using the outcome vulnerability approach adopted by the IPCC. A contextual vulnerability assessment, using the bottom-up, resource-based framework is a more inclusive approach for policymakers to adopt effective mitigation and adaptation methodologies to deal with the complexity of the spectrum of social and environmental extreme events that will occur in the coming decades, as the range of threats are assessed, beyond just the focus on CO2 and a few other greenhouse gases as emphasized in the IPCC assessments.”

In the assessment of climate risks, the approach we recommend is an inversion of the IPCC process, where the threats from climate, and from other environmental and social risks are assessed first, before one inappropriately and inaccurately runs global climate models  to provide the envelope of future risks to key resources.

Comments Off on Our Chapter “Dealing with complexity and extreme events using a bottom-up, resource-based vulnerability perspective” By Pielke Sr Et Al 2012 Has Appeared

Filed under Research Papers, Vulnerability Paradigm