Monthly Archives: January 2010

Q & A How Skillful Are The Global Climate Models Given The Relatively Small Radiative Human-Caused Forcing?

Dan Hughes has asked a very good question!

Professor Pielke,

I have a candidate for Question of the Day.

The GCMs, and very likely all mathematical models of the transient behavior of the Earth’s Climate Systems, use approximations to the complete fundamental equations of physical phenomena and processes. This statement should not be taken to be a condemnation of ‘models of’ physical phenomena and processes in contrast to ‘use of’ the complete fundamental equations for all the physical phenomena and processes. The latter equations are seldom used in complex real-world applications.

I will focus on the mass and energy equations and associated phenomena and processes. Mass and energy are always strictly conserved, and this characteristic must be critically preserved through the formulation of the continuous equations, the discrete approximations, the numerical solution methods applied to the latter, and the temporal and spatial resolution employed at application time. At each step in this sequence the conservation of mass and energy assured in the previous steps can be un-done if extremely careful analysis is not carried out.

Here’s my question.

The changes in energy content and its distribution among the Earth’s systems expected to occur due to all the impacts by humans are relatively small; less than 10 W/m^2. This compares with the incident energy at the TOA of about 1370 W/m^2, and the few hundred W/m^2 of interest at the Earth’s surface.

Are the model equations for mass and energy conservation, including the all-important parameterizations, sufficiently precise to accurately capture to a sufficient degree of fidelity to the real-world the effects of this small change.

As an example, the expected changes represent less than 1%, more like 0.4%, of the incident energy at the TOA. At the Earth’s surface, the changes represent maybe 1.5% of the base-level energy flux. The changes in the total energy content ( mass * specific energy ) relative to the content at the base conditions, will be vanishingly small.

I strongly suspect that the Climate Science Community is relying heavily on the fact that at extremely long-range time scales, the radiative-equilibrium concept will obtain and that at this new state the effects of the very small changes will be plainly evident.

I also strongly suspect that the fidelity of the model equations, at all the steps mentioned above, will never be of sufficient fidelity to the real world to ‘predict’ the effects of such small changes over short time scales.

Thank you for your attention to this question and associated issues.

Dan

Here is my answer to this excellent question!

The climate models work hard to assure the conservation of the global average mass and kinetic energy.  For example, the sum over the globe of the surface pressures at each grid point must be unchanged in order to assure mass conservation. In the context of mesoscale models I discuss these conservation requirements in Chapter 12 of

Pielke, R.A., Sr., 2002: Mesoscale meteorological modeling. 2nd Edition, Academic Press, San Diego, CA, 676 pp.

However, the conservation of mass and energy conservation on the global scale is a necessary condition for skillful simulations but it is not a sufficient condition for skillful multi-decadal climate predictions.

In my Chapter 12, I present a set of evaluation requirements which includes the comparison of the model predictions with the observations. In the context of forecasting the effect on climate metrics due to relatively small changes of radiative heating from human climate forcings, the only metric that (arguably) has shown any skill with respect to observations is the global average surface temperature and the upper ocean heat content multi-decadal linear trends, but even here, there has been disagreement in recent years (e.g. see and see). There is no regional skill on this time scale (e.g. see).

Thus, there remains quite a bit of effort to demonstrate that the multi-decadal global climate models are skillful forecast tools.  I discuss the three types of uses of models in my post

What Are Climate Models? What Do They Do?

The mult-decadal climate models are effective tools to explore climate processes [ Process studies]. They are not, however, skillful tools for multi-decadal climate prediction [Forecasting]

Thanks again Dan Hughes for the opportunity to present your viewpoint.

Comments Off on Q & A How Skillful Are The Global Climate Models Given The Relatively Small Radiative Human-Caused Forcing?

Filed under Climate Models, Q & A on Climate Science

Paper Which Documents The Importance Of Spatially Heterogenous Human Climate Forcing – Shindell and Faluvegi 2009

Our research and that of a number of our colleagues have emphasized the major importance of regional heterogenous human climate forcings with respect to their effect on atmospheric and ocean patterns on all time scales. For example, in

National Research Council, 2005: Radiative forcing of climate change: Expanding the concept and addressing uncertainties. Committee on Radiative Forcing Effects on Climate Change, Climate Research Committee, Board on Atmospheric Sciences and Climate, Division on Earth and Life Studies, The National Academies Press, Washington, D.C., 208 pp,

it is written

“Forcings with significant spatial variability can have regional magnitudes much greater than their global averages. Aerosols, and to a lesser extent tropospheric ozone, have shorter lifetimes than the well-mixed greenhouse gases, and therefore their concentrations are higher in source regions and downwind (e.g., Charlson et al., 1991; Kiehl and Briegleb, 1993; Mickley et al., 1999). Forcing due to land-use and land-cover changes also has significant spatial heterogeneity, leading to spatial variability in the associated climate response. The traditional global mean radiative forcing provides no information about this regional structure, so many researchers have begun to present estimates of radiative forcing on a regional scale as derived from models or observational campaigns.”

In our paper

Matsui, T., and R.A. Pielke Sr., 2006: Measurement-based estimation of the spatial gradient of aerosol radiative forcing. Geophys. Res. Letts., 33, L11813, doi:10.1029/2006GL025974

we found that the effect of human aerosols on the gradient of radiative heating on regional scales is on the order of 60 times that of the well-mixed greenhouse gases! We wrote in our abstract

” Unlike GHG [well-mixed green-house gases], aerosols have much greater spatial heterogeneity in their radiative forcing. The heterogeneous diabatic heating can modulate the gradient in horizontal pressure field and atmospheric circulations, thus altering the regional climate.”

There was a paper published earlier in 2009 which supports this perspective (and which I originally posted on in April; see and am repeating today). It is

Drew Shindell and Greg Faluvegi, 2009: Climate response to regional radiative forcing during the twentieth century. Nature Geoscience Vol 2 April 2009. -294.

The abstract reads

“Regional climate change can arise from three different effects: regional changes to the amount of radiative heating that reaches the Earth’s surface, an inhomogeneous response to globally uniform changes in radiative heating and variability without a specific forcing. The relative importance of these effects is not clear, particularly because neither the response to regional forcings nor the regional forcings themselves are well known for the twentieth century. Here we investigate the sensitivity of regional climate to changes in carbon dioxide, black carbon aerosols, sulphate aerosols and ozone in the tropics, mid-latitudes and polar regions, using a coupled ocean–atmosphere model. We find that mid- and high-latitude climate is quite sensitive to the location of the forcing. Using these relationships between forcing and response along with observations of twentieth century climate change, we reconstruct radiative forcing from aerosols in space and time. Our reconstructions broadly agree with historical emissions estimates, and can explain the differences between observed changes in Arctic temperatures and expectations from non-aerosol forcings plus unforced variability. We conclude that decreasing concentrations of sulphate aerosols and increasing concentrations of black carbon have substantially contributed to rapid Arctic warming during the past three decades.”

The text includes

Our results suggest that aerosols have had a large role in both global and regional climate change during the twentieth century. Both these results and forward modelling… indicate that Arctic climate is especially sensitive to Northern Hemisphere short- lived pollutants. Arctic trends may also be related to internal atmosphere-ocean dynamics…. Our analysis is consistent with a large role for internal variability, but suggests an even greater impact from aerosol forcing on trends since 1930. A large aerosol contribution to mid-twentieth century Arctic cooling perhaps accounts for the lack of polar amplification in some studies… During 1976-2007, we estimate that aerosols contributed 1.09 +/- 0.81 C to the observed Arctic surface temperature increase of 1.48 +/- 0.28 C. Hence, much of this warming may stem from the unintended consequences of clean-air policies that have greatly decreased sulphate precursor emissions from North America and Europe (reducing the sulphate masking of greenhouse warming) and from large increases in Asian black carbon emissions.”

and

“Current understanding of AIE [aerosol indirect effects] under Arctic conditions is quite limited… Hence, Arctic AIE is included only crudely here. However, our results indicate that the net impact on 1890-2007 Arctic surface temperatures has been -0.6 C  from tropical aerosols, +0.4 C from mid-latitude aerosols and +0.5 C from Arctic aerosols. Hence, long-term aerosol-induced Arctic climate change is quite sensitive to forcing at lower latitudes…, which is not subject to these uncertainties. During 1976-2007, however, large changes in mid- latitude emissions have increased the importance of local Arctic forcing, with estimated surface temperature changes of -0.3 C from tropical aerosols, +0.6 C from mid-latitude aerosols and +0.8 C from Arctic aerosols during this time. It is thus important to better understand AIE under Arctic conditions.

Our calculations suggest that black carbon and tropospheric ozone have contributed ~0.5-1.4 C and ~0.2-0.4 C, respectively, to Arctic warming since 1890, making them attractive targets for Arctic warming mitigation. In addition, they respond quickly to emissions controls, and reductions have ancillary benefits including improved human and ecosystem health.”

This paper  illustrates the movement of the climate community to a broader perspective on how humans are affecting the climate system.  In light of the recent cold and snow across large areas of North America, it is worth reemphasizing the dominant role of regional atmospheric and ocean circulation patterns (due to natural climate variations and change, as modulated by human climate forcings) on the weather that results.

Comments Off on Paper Which Documents The Importance Of Spatially Heterogenous Human Climate Forcing – Shindell and Faluvegi 2009

Filed under Climate Change Forcings & Feedbacks

News Release On The Importance Of Soot In The Climate System

I have posted a number of times on the role of soot as a first order climate forcing (e. g. see) as well as published papers on this topic (e.g. see).  Soot (black carbon) results from industrial and biomass burning and alters regional diabatic heating of the atmosphere when it is suspended in the air and when it changes the surface albedo when it deposits at the surface (particularly over snow and ice).   It is a first order climate forcing that not only affects the global average radiative forcing, but regional climate forcings which have a direct effect on atmospheric and ocean circulation patterns.

TokyoTom has alerted us to an article by Graham Cogley that appeared at Enviromentalresearchweb blog  which summarizes some of the recent research on this topic. It is titled

Soot and glaciers

and reads

“A little soot can make a big difference to the brightness of snow. Freshly fallen snow, when clean, is one of the brightest of substances, reflecting well over 90% of incident sunlight and presenting the risk of snow blindness to ill equipped travellers on glaciers.

As the snow ages, the snowflakes collapse and become rounded. Opportunities for photons to bounce off and head back into the sky become fewer. Opportunities for absorption become more frequent because the photons spend more of their time passing through grain interiors. Eventually, as the snow turns into glacier ice, the reflected fraction of incoming radiation drops to as low as one half or less.

There is more than this to the radiative physics of snow and ice. For example the wavelength of the impinging photon makes a difference, and so does the angle at which it strikes the surface (more reflection when the angle is closer to horizontal). When a thaw begins, some of the snow turns into liquid water, which, ironically, is one of the darkest of substances. So wet snow is not particularly bright. Dirt also makes a difference.

If the dirt is black enough then even a small amount reduces significantly the brightness, or albedo, of the snow. This was shown dramatically as long as 30 years ago by Warren and Wiscombe. The more soot, the more darkening, but as little as a few parts per billion by weight reduces the albedo of pure snow (that is, collections of grains of ice) by a few per cent in the visible part of the spectrum. We also get significant sunlight in the (invisible) near-infrared, but the effect of soot is much reduced there because ice is itself very dark in the near-infrared. All the same, soot makes a difference.

Photon for photon, exposed glacier ice yields two or more times as much melt water than clean snow, assuming both are at the melting point. So, we are very interested in anything, such as soot, that reduces the radiative contrast between the ice and the overlying snow. What with industrialization, growth of the human population and more intense clearance of forests by burning, there is more soot about now than there used to be. How much of it actually reaches the glaciers, and precisely how large its contribution is to the faster rates of mass loss observed in recent decades, remain open questions. But it would be surprising if we were to look for evidence of a link and failed to find it.

Evidence of a link is just what Xu Baiqing and colleagues, writing in a recent issue of the Proceedings of the National Academy of Sciences, appear to have found. They measured soot concentrations in ice cores from five Tibetan glaciers, and found radiatively significant amounts in all but one, with evidence for recent increases in at least two. These glaciers are downwind of two of the world’s largest sources of airborne soot, India and western Europe. (Yes, Tibet is a long way from Europe, but the soot particles are tiny and once they are aloft they can travel thousands of kilometres before being washed out.)

And at the recent Fall Meeting of the American Geophysical Union, Bill Lau of NASA drew attention to another way in which soot can affect glacier mass balance. While the soot is still in the atmosphere it constitutes what he calls an “elevated heat pump”. It heats the air (rather than the surface), the heated air rises, and new air is drawn in from elsewhere to replace it. In the Himalayan-Tibetan region, the new air comes from the south and is warm and moist, so this amounts to an induced intensification of the summer monsoon. Warmer air means more melting, but moister air means more precipitation and therefore, where the temperature is right, more snowfall. Working out the net impact on the glaciers, then, will be a challenge.

These studies leave us a long way from nailing down soot as one of the reasons for more negative glacier mass balance, which will require concurrent measurements of sootfall, incident radiation, temperature and rates of snowfall and melting. But at the very least, the soot concentration measurements show that the soot is there, and the most solid part of the deductive chain – the fact that soot makes snow absorb more radiation – is already firmly in place. Greenhouse gas is not the only pollutant we should be worrying about.”


Comments Off on News Release On The Importance Of Soot In The Climate System

Filed under Climate Change Forcings & Feedbacks, Climate Science Reporting

Guest Post By Thomas Chase On An Update On “Was The 2003 European Heat Wave Unusual In A Global Context”

Guest Post By Thomas N. Chase

Update on

Chase, T.N., K. Wolter, R.A. Pielke Sr., and Ichtiaque Rasool, 2006: Was the 2003 European summer heat wave unusual in a global context? Geophys. Res. Lett., 33, L23709, doi:10.1029/2006GL027470.

In Chase et al. (2006) we documented the June, July, and August averaged thickness temperature anomalies in terms of standard deviations exceeded and concluded that, while the European heatwave was unusual, natural variability in terms of ENSO and volcanic eruptions exceeded the extremes of the European heatwave. In subsequent commentary on this paper, Connelly (2006) found that the European heat wave was indeed quite unusual if surface temperature data was used prompting Chase et al. (2008) to conclude, along with others, that the unusual heat wave was confined near the surface was the result of surface processes and not a general warming of the troposphere as would be expected in a global warming scenario. We also concluded that with the updated time series that an upward trend in extreme variability was starting to appear. 

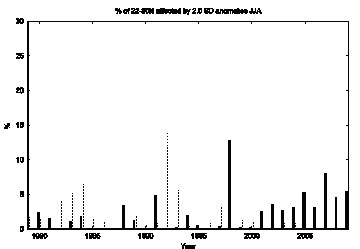
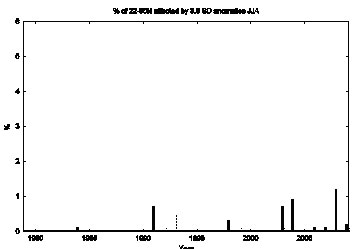
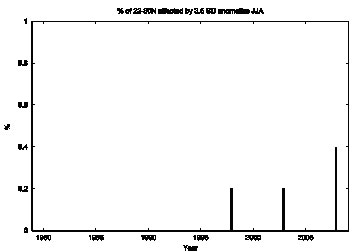
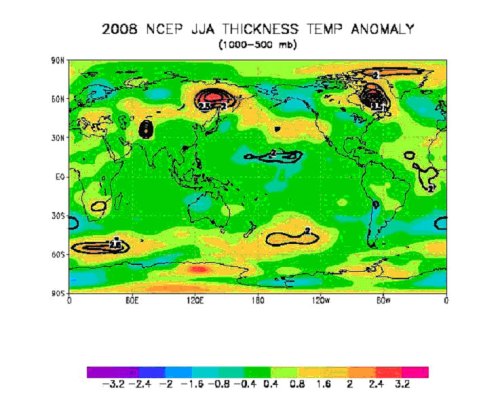
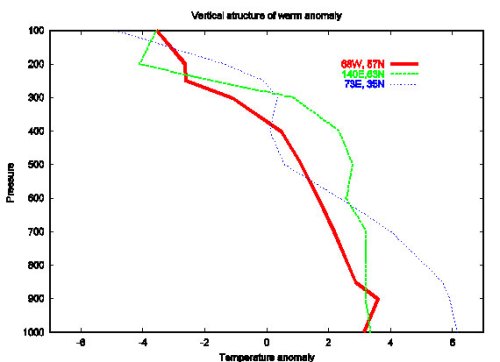
Here we update the original time series through 2009 as shown in Figures 1a,b,c which show the percentage of the Northern Hemisphere extratropics affected by 2.0, 3.0, and 3.5 SD anomalies, respectively. There is now a clear and significant upward trend in the most extreme variability (Table 1) with the summer of 2008 being the most extreme yet. This is due to very large warm anomalies in northeastern Canada, around Greenland, and also in Siberia (Figure 2). Interestingly, these extremes in SD exceeded are largest in the near-surface layers of the atmosphere than in the mid-troposphere despite the temperature variability at high latitudes being much larger near the surface than in the mid troposphere (e.g., Peixoto and Oort, 1992; Figure 7.8) again suggesting that surface processes are more responsible than generalized climate warming.  

Massive Arctic sea ice melt was likely one component of the unusual near-surface climate in Canada, the Labrador/Baffin Seas, and Greenland.


2.0 SD                              

 3.0 SD                                      

 3.5 SD          

Figure 1. Histograms of percentage of the Northern Hemisphere from 22-80°N covered by thickness temperature anomalies exceeding 2.0, 3.0, and 3.5 standard deviations, respectively. Cold anomalies are in dashed lines, warm anomalies in solid lines. Note the different vertical scales.

Figure 2. Thickness temperature anomalies 1000-500 mb for JJA 2008 (color shaded) and standard deviations exceeded (2.0, 3.0, 3.5, 4.0 SD) contoured.

Figure 3. Major Northern Hemisphere warm temperature anomalies by pressure level: 68°W, 57°N is the eastern Canada Greenland anomaly, 140°E, 63°N is the Siberian anomaly, 73°E, 35°N is the central Asia anomaly.

SD Exceeded Slope (%/year) P-Value
2.0 warm 0.152 0.01
3.0 warm 0.015 0.02
3.5 warm 0.003 (3 data points) 0.06
2.0 cold -0.998 0.11

 Table 1: Slopes and P-values for linear regressions for time series in Figure 1 and for 2.0 SD cold anomalies (not pictured in Figure 1). Higher-order cold anomalies are data sparse and are not given. 3.5 warm anomalies are also data sparse and not reliable (3 values) and are given only for completeness.

References

Chase, T. N., K. Wolter, R. A. Pielke, Sr., and I. Rasool, 2008. Reply to comment by W. M. Connolley on; Was the 2003 European summer heat wave unusual in a global context? Geophys. Res. Lett., 35, L02704, doi:10.1029/2007GL031574.

Chase, T. N., K. Wolter, R. A. Pielke, Sr., and I. Rasool, 2006. Was the 2003 European summer heat wave unusual in a global context? Geophys. Res. Lett., 33, L23709, doi:10.1029/2006GL027470.

Connelly, W.M., 2008. Comment on: “Was the 2003 European summer heat wave unusual in a global context?” Geophys. Res. Lett., 35, L02703,  doi: 10.1029/2007GL031171.

Peixoto, J. P., and A.H Oort, 1992. Physics of Climate. American Institute of Physics. New York.

Comments Off on Guest Post By Thomas Chase On An Update On “Was The 2003 European Heat Wave Unusual In A Global Context”

Filed under Climate Change Metrics, Guest Weblogs

Comments On “Oscilloscope – Britain’s Cold Snap Is Explained By The Arctic Oscillation” in the Economist

UPDATE: Feb 10 2010

The author of the article below has sent me a follow up which I have posted below with his permission. I appreciate his taking time time to follow up and clarify.

Dear Dr Pielke

I fear our article may not have been well expressed, because I think you have misinterpreted it. The point of the line “The atmosphere is not just about temperature, though. Wind patterns matter too” was not to deny the fundamental temperature/pressure/wind field link, but to say that while the temperature patterns associated with the negative phase of the oscillation might tend to decay ice, the wind patterns associated with the same phase might tend to preserve it. I’m sorry that wasn’t clear.

Best wishes

Oliver Morton
Energy and Environment Editor
The Economist

*******************************************

The Economist has an interesting article in their January 11 2010 issue titled

Oscilloscope – Britain’s cold snap is explained by the Arctic oscillation

which (correctly) reports that the recent cold and snowy weather in the UK (and elsewhere) is a result of regional atmospheric circulation patterns. Excerpts from the article read

“IT IS an ill wind that blows no good, as people have been remarking to each other since at least the 16th century. In the case of the bitter easterlies that have brought Britain colder, snowier weather than has been seen for a couple of decades…”

“The atmosphere cannot make heat, or even hold that much of it. There is more heat stored in the top four metres of the oceans than in all the Earth’s atmosphere. 

So when the atmosphere cools down one part of the globe, it is a good rule of thumb that it is warming some other part. In the case of the current mid-latitude chill, it is the high latitudes that are seeing the warming. In Greenland and the Arctic Ocean, December was comparatively balmy. The air above Baffin Bay and the Davis Strait was 7ºC warmer than usual (though that still left it pretty cold).

This pole-centred roundel of warm-in-cold is symptomatic of what climatologists call the negative phase of the Arctic oscillation (AO). It is a mode of atmospheric circulation in which the stratosphere is unusually warm and westerly winds, which normally bring warmth from the oceans to northern Europe, are unusually weak.”

However, there is a significant misunderstanding that is presented in the article. It is written that

“The atmosphere is not just about temperature, though. Wind patterns matter too.”

The article is correct that wind patterns matter (as this is what transports the cold air from the higher latitudes and warm air from lower latitudes). However, the wind pattern is determined by the three-dimensional wind field.  This temperature field creates the three dimensional pressure field, and this pressure field produces the wind patterns. This is well understood in synoptic meteorology, as I have summarized in my lecture notes

Pielke Sr., R.A. 2002: Synoptic Weather Lab Notes. Colorado State University, Department of Atmospheric Science Class Report #1, Final Version, August 20, 2002.

The cold air in the troposphere at higher latitudes, for example, is why the winds in the middle and upper troposphere generally blow from west to east (i.e. the “westerly jet stream; also called the “polar jet”). This also explains why these winds are stronger in the winter than in the summer, since the higher latitudes are colder in the winter.  If you fly from New York to London, you typically arrive more quickly than when you fly from London to New York. The Arctic Oscillation which is the reason for the cold snowy period in the UK is a result of the spatial distribution of tropospheric temperatures.

Thus, despite the implication in the Economist article that wind patterns are distinct from the temperatures, they are intimately related to each other with the temperature field determining the wind patterns. This is why alterations in the spatial pattern of diabatic heating by human activity, such as we identified in our paper

Matsui, T., and R.A. Pielke Sr., 2006: Measurement-based estimation of the spatial gradient of aerosol radiative forcing. Geophys. Res. Letts., 33, L11813, doi:10.1029/2006GL025974.

is so important.  These alterations affect the wind field, and thus the weather than is experienced regionally. This is a much more important issue than changes in the global average surface temperature in terms of the effects on society and the environment.


Comments Off on Comments On “Oscilloscope – Britain’s Cold Snap Is Explained By The Arctic Oscillation” in the Economist

Filed under Climate Change Forcings & Feedbacks, Climate Change Metrics

News Article Titled “Desertification May Have Retarded Global Warming By As Much As 20%”

Asher Meir has alerted us to a news article titled “Desertification may have retarded global warming by as much as 20%”  by Ehud Zion Waldoks which has appeared in the Jerusalem Post. Excerpts from the article read

“In an article published on Friday in the journal Science, Prof. Dan Yakir and Dr. Eyal Rotenberg of the Environmental Sciences and Energy Research Department discuss their analysis of findings from the Yatir Forest research station.”

“The desert reflects sunlight and releases infrared radiation, which has a cooling effect. And in a world in which desertification is continuing at a rate of about six million hectares a year, that news might have a significant effect on how we estimate the rates and magnitude of climate change. “

Of course there significant negative effects of desertification, including the loss of biodiversity and the creation of an environment for dust storms. The study does show though yet another example of the important role of human cased landscape processes within the climate system.

Comments Off on News Article Titled “Desertification May Have Retarded Global Warming By As Much As 20%”

Filed under Climate Change Forcings & Feedbacks, Climate Science Reporting

Information On The American Geophysical Union Natural Hazards Website On The Haiti Earthquake Prepared By Professor Alik Ismail-Zadeh

The American Geophysical Union Natural Hazards Focus Group, led by Professor Alik Ismail-Zadeh, Chair of the AGU Natural Hazards Focus Group [of which I am a member along with outstanding colleagues; see] has posted information on the earthquake in Haiti.

It was prepared by Professor Ilia Zaliapin and is available at Haiti earthquake of January 12, 2010.

In this post, Professor Ismail-Zadeh wrote an excellent statement on what policymakers and others should learn from this tragic event.

“Humans face natural hazards at different scales in time and space. The hazards affect life and health; they have a dramatic impact on the sustainability of society, especially in societies that are vulnerable because of their geographic location, poverty, or both. The first decade of the 21st century has been marked by a significant number of natural disasters, such as floods (e.g., in West and Central Europe in 2002), hurricanes (e.g., Katrina in 2005), earthquakes (Aceh-Sumatra in 2004, Kashmir in 2005, Sichuan in 2008) accompanied by landslides, tsunami (Indian Ocean in 2004, killed 230,000), wildfires (in California and Australia), etc.

On 12 January 2010 Haiti was struck by a violent earthquake; its epicenter was located nearby the capital city of Port-au-Prince. According to the latest information, the number of casualties in the city alone ranges from 100,000 to 150,000 (CNN, 17.01.2010). Our hearts go out to those in Haiti who have suffered losses of loved people and personal properties during the earthquake disaster.

Obviously, humans will never be able to prevent the occurrences of natural phenomena entirely. However, scientists are able to gain a better understanding of the complex mechanisms that cause the disasters and to deliver their knowledge to disaster management agencies in order to be prepared to cope with such extreme events. Haiti was not prepared to cope with the large earthquake, although geophysicists warned about the next big event (Manaker et al., Geophys. J. Int., 174, 889-903, 2008).

“The tendency to reduce the funding for preventive disaster management of natural catastrophes rarely follows the rules of responsible stewardship for future generations neither in developing countries nor in highly developed economies” (Ismail-Zadeh and Takeuchi, Nat. Hazards, 42, 459-467, 2007). The investment to avoid losses tends not to be easily accepted in political decision making as compared with that to gain positive benefits. It is because the benefit of preventing losses, however long lasting it is, is not easily visible while the positive benefit is obvious and can easily be agreed by people. A large investment is made, when a big disaster due to an earthquake occurs, and the investment decreases till the next large earthquake. If about 5 to 10% of the funds, necessary for recovery and rehabilitation after a disaster, would be spent to mitigate an anticipated extreme event, it could in effect save lives, constructions, and other resources.

Scientists must act today and implement state-of-the-art measures to protect society from rare but recurrent extreme natural catastrophes. Otherwise we will witness again and again the tragic aftermaths of disaster, which could have been avoided.”

Comments Off on Information On The American Geophysical Union Natural Hazards Website On The Haiti Earthquake Prepared By Professor Alik Ismail-Zadeh

Filed under Vulnerability Paradigm

Interesting News Article In Nature Titled “The Real Holes In Climate Science”

The is an interesting news article by Quirin Schiermeier in Nature titled

“The Real Holes In Climate Science”

This news summary contains both recognition (finally) of some the complications of assessing the role of humans in the climate system, but also continues to perpetuate misunderstandings of the latest science.

First, here are the main deficiencies in climate science (those parts of the text which I agree with) reprinted from the Nature article as excerpts;

1. “The sad truth of climate science is that the most crucial information is the least reliable. To plan for the future, people need to know how their local conditions will change, not how the average global temperature will climb. Yet researchers are still struggling to develop tools to accurately forecast climate changes for the twenty first century at the local and regional level.”

2. “….. Unfortunately, when it comes to precipitation, that is about all the models agree on. The different simulations used by the IPCC in its 2007 assessment offer wildly diverging pictures of snow and rainfall in the future ….. The situation is particularly bad for winter precipitation, generally the most important in replenishing water supplies. The IPCC simulations failed to provide any robust projection of how winter precipitation will change at the end of the current century for large parts of all continents.”

3. “Atmospheric aerosols — airborne liquid or solid particles — are a source of great uncertainty in climate science. Despite decades of intense research, scientists must still resort to using huge error bars when assessing how particles such as sulphates, black carbon, sea salt and dust affect temperature and rainfall.”

Each of these admissions move climate science further from the frequent claims that we hear that climate science issue is settled.

The article does, unfortunately perpetuate erroneous conclusions about the science. A number of these error are clearly stated in a section of the article “Enduring climate myths” on page 286 of the article. Several of the “myths” actually have substantive scientific evidence which refutes them, while others are not disputed by anyone.

Below I have commented on the “myths” ;

1. “Myth #1: “Climate models can’t provide useful information about the real world”.

I agree that climate models provide valuable insight into climate processes. I am aware of no one who concludes otherwise. Where there is disagreement is on their skill at regional and global averaged multi-decadal forecasts. Clearly, even the reporter concludes there is no regional skill on this time scale

2. Myth #2: “Global warming stopped ten years ago.”

Actually global warming, as measured by lower tropospheric temperatures; e.g. see Figure 7 in the RSS MSU data) has been close to zero at least since 2002, and by upper ocean heat content (see)  since 2003 (with other data such as Levitus showing since 2005 (see).

3. Myth #3: “Temperatures were higher in pre-industrial times”.

On this issue, I defer to experts who investigate proxy records.  However, the kludging together of proxy data with the instrument record has always been a dubious excercise since they do not measure the same climate metric. I have discussed the divergence issue with respect to proxy and instrument temperature data based on the research of colleagues (see and see)

4. Myth #4:”Temperature records taken in the lower atmosphere indicate that the globe is not warming”.

The link to the UAH MSU data (see bottom figures in this post) and the RSS MSU data (see Figure 7) show that since 2002, warming has not occurred, on average, over this time period.  Over the longer time period (since 1979) there has been warming. However, the failure by the reporter to recognize in the news article that this warming, at least for a few years, has stopped is obvious.

5. Myth #5: “A few degrees of warming are not a big deal.”

This is a vague statement.  For example, an increase in nighttime minimum temperatures of several degrees might even be beneficial for some agriculture locations, while such an increase in the maximum temperatures could result in major problems. The reporter refers to a global average  temperature warming, but without knowing how such an increase in temperatures were distributed regional and locally, and through the diurnal cycle, there is no way to know if it is a “big deal” or not. 

6. Myth #6: “Measured increases in temperature reflect the growth of cities around weather stations rather than global warming.”

This claim is refuted in several studies (e.g. see and see). In the first link, it is reported

“Across the (United States) as a whole, approximately 50 percent of the warming that has occurred since 1950 is due to land use changes (usually in the form of clearing forest for crops or cities) rather than to the emission of greenhouse gases,” Stone said. “Most large U.S. cities … are warming at more than twice the rate of the planet as a whole — a rate that is mostly attributable to land use change.”

The article is a step forward from other news summaries of climate science. However, it still perpetuates significant misunderstandings and erroneous conclusions about our actual understanding of the climate system.

Comments Off on Interesting News Article In Nature Titled “The Real Holes In Climate Science”

Filed under Climate Science Misconceptions, Climate Science Reporting

Comment On “AMS2010: Data Gaps And Errors May Have Masked Warming” By Olive Heffernan At The Weblog Climate Feedback

There is a post on the Nature website Climate Feedback by Olive Heffernan titled

AMS2010: Data gaps and errors may have masked warming

This is a remarkable post in that it fails to properly assess all of the data sources for climate system heat changes. Excerpts from the post read

“New analyses provide preliminary evidence that temperature data from the UK Met office may under-estimate recent warming. That’s the conclusion of a talk given here today by Chris Folland of the Met Office Hadley Centre. Folland says that there is a very good chance that there has been more warming over land and over the ocean in the past decade than suggested by conventional data sets, but he says that the issues with land and ocean data are entirely unrelated.’

“For land, the problem of underestimating warming stems from data gaps in the average monthly temperature data set of the Met Office Hadley Centre, known as HadCruT3. Temperatures over the past decade were recently re-analyzed using a european climate model by Adrian Simmons of the European Centre for Medium-Range Weather Forecasts in Reading, UK and colleagues, and are soon to be published in the Journal of Geophysical Research [subscription]. Simmons and colleagues compared air temperature and humidity data collected over the past decade by the Hadley Centre with re-analyzed data for the same period. Average warming over land was larger for the fully sampled re-analyzed data than for the HadCRUT3 temperature data. The difference between the data sets is particularly notable for northeast Canada, Greenland and nothern parts of Asia, areas which are warming particularly rapidly.”

If the land surface temperatures were actually warmer than have been sampled, this results in even more divergence between the surface temperature and lower tropospheric temperature trends which we quantified in

Klotzbach, P.J., R.A. Pielke Sr., R.A. Pielke Jr., J.R. Christy, and R.T. McNider, 2009: An alternative explanation for differential temperature trends at the surface and in the lower troposphere. J. Geophys. Res., 114, D21102, doi:10.1029/2009JD011841.

Chris Folland also ignored the unresolved issues and systematic biases that we identified in our paper

Pielke Sr., R.A., C. Davey, D. Niyogi, S. Fall, J. Steinweg-Woods, K. Hubbard, X. Lin, M. Cai, Y.-K. Lim, H. Li, J. Nielsen-Gammon, K. Gallo, R. Hale, R. Mahmood, S. Foster, R.T. McNider, and P. Blanken, 2007: Unresolved issues with the assessment of multi-decadal global land surface temperature trends. J. Geophys. Res., 112, D24S08, doi:10.1029/2006JD008229.

The Heffernan weblog post further writes

“For the ocean data, it’s a different issue. John Kennedy of the Met Office and colleagues previously reported in Nature [subscription] that changes in the methods used to collect sea surface temperature (SST) data at the end of World War II caused problems in comparing pre- and post-war data. Now they have a new analysis (yet to be published) suggesting that smaller changes in data collection methods since the end of the war could also be significant.

Over the past 20 years, the primary source of SST data has changed from ships to ocean buoys. Because ships warm the water during data collection, there has been a drop in recorded SSTs since bouys,which are more accurate, became the main data source. So what could appear to be a relative cooling trend in SSTs over the past decade may actually just due to changes in errors in the data. Scientists are confident that the buoy data are more accurate because they compare favourably with reliable satellite data.”

The upper ocean heat data shows no appreciable warming in the upper ocean since at least 2005 (and perhaps since 2003) as I discussed in my paper

Pielke Sr., R.A., 2008: A broader view of the role of humans in the climate system. Physics Today, 61, Vol. 11, 54-55.

The satellite monitored surface temperatures similarly show a lack of warming over this time period; the current global sea surface temperature trends can be viewed at the GISS website (see) where for the period 2003 to 2009 on the annual average, there is a even negative trend in this time period for some latitude bands (see) [see also the land and ocean temperature changes figure in the section “Annual Mean Temperature Change for Land and Ocean in http://data.giss.nasa.gov/gistemp/graphs/ where a divergence between the land and ocean data trens in the last 10 years is quite distinct].

While, whether the trends are positive or negative from 2003 to 2009 does not refute a longer time global warming (which could, of course, recommence), statements by Chris Folland and John Kennedy that can be easily shown to conflict with even a cursory examination of the data, will result in a dismissal of their conclusions by objective climate scientists.

Comments Off on Comment On “AMS2010: Data Gaps And Errors May Have Masked Warming” By Olive Heffernan At The Weblog Climate Feedback

Filed under Climate Change Metrics, Climate Science Misconceptions

Interview By Ray Taylor At OurClimate.Eu Titled “Copenhagen, Europe, Africa and a Vulnerability Paradigm”

Ray Taylor at OurClimate.eu of the Land-Atmosphere Resilience Initiative [ see and see also] conducted an interview of me titled

Copenhagen, Europe, Africa and a Vulnerability Paradigm

The article starts with

“RAY TAYLOR: Good morning Professor Pielke and thank you for agreeing to this interview for the European Union OurClimate portal.

What would your advice be to EU and African countries for the Copenhagen climate talks?

PROFESSOR ROGER PIELKE Sr: I recommend that the vulnerabilities, from a bottom-up, natural resources* perspective be identified, rather than starting with the inappropriate (and ineffective) narrow emphasis on carbon emissions. The vulnerability framework is more inclusive and will permit more effective policymaking.

There also needs to a recognition that climate change is much more than global warming. Even without global warming, humans are altering the climate system significantly.”

Read the rest of the interview here. As a clear message from the Haitian earthquake, there is a need to assess vulnerabilties of society to the entire spectrum of natural and human caused risks, and to develop policies to reduce these threats. The available financial and other resources need to be optimized in order to most effectively minimize these risks.

A focus on funding CO2 reductions which result in a reduction of funds for other actions, such as developing more earthquake resistant urban areas, is not a wise expenditure of financial resources.

Interested readers can view more of my perspective (and that of other AGU Fellows) in our article

Pielke Sr., R., K. Beven, G. Brasseur, J. Calvert, M. Chahine, R. Dickerson, D. Entekhabi, E. Foufoula-Georgiou, H. Gupta, V. Gupta, W. Krajewski, E. Philip Krider, W. K.M. Lau, J. McDonnell,  W. Rossow,  J. Schaake, J. Smith, S. Sorooshian,  and E. Wood, 2009: Climate change: The need to consider human forcings besides greenhouse gases. Eos, Vol. 90, No. 45, 10 November 2009, 413. Copyright (2009) American Geophysical Union.

Comments Off on Interview By Ray Taylor At OurClimate.Eu Titled “Copenhagen, Europe, Africa and a Vulnerability Paradigm”

Filed under Climate Science Reporting, Interviews