Category Archives: Climate Models

New Paper “Indian Ocean Warming Modulates Pacific Climate Change” By Luo Et Al 2012

Jing-Jia Luoa,Wataru Sasaki, and Yukio Masumoto, 2012: Indian Ocean warming modulates Pacific climate change. Published online before print October 29, 2012, doi: 10.1073/pnas.1210239109 PNAS October 29, 2012

The abstract reads [highlight added]

It has been widely believed that the tropical Pacific trade winds weakened in the last century and would further decrease under a warmer climate in the 21st century. Recent high-quality observations, however, suggest that the tropical Pacific winds have actually strengthened in the past two decades. Precise causes of the recent Pacific climate shift are uncertain. Here we explore how the enhanced tropical Indian Ocean warming in recent decades favors stronger trade winds in the western Pacific via the atmosphere and hence is likely to have contributed to the La Niña-like state (with enhanced east–west Walker circulation) through the Pacific ocean–atmosphere interactions. Further analysis, based on 163 climate model simulations with centennial historical and projected external radiative forcing, suggests that the Indian Ocean warming relative to the Pacific’s could play an important role in modulating the Pacific climate changes in the 20th and 21st centuries.

The conclusions include the text

“It is suggested that the multidecadal variability could be modulated or partly forced by anthropogenic radiative forcing, particularl the offset effects between GHGs and aerosol (31, 32). However, the signal-to-noise ratio (i.e., the ratio of the variance of multimodel ensemble mean to the variance of intermodel spreads) is small; this indicates uncertainties in attributing the multidecadal changes to external forcing. Besides, understanding exact mechanisms responsible for the multidecadal fluctuations and how global warming might modulate the multidecadal changes remains a challenge…..our results suggest that differences in the response to anthropogenic forcing over individual ocean basins, together with the interinfluence between the tropical IO and the Pacific, may affect not only the centennial trends but also multidecadal changes of the Pacific climate.”

This is yet another paper that highlights the complexity of the climate system and the difficulty skillful multi-decadal climate predictions and in seeking to attribute regional climate to particular climate forcings.

source of image

Comments Off on New Paper “Indian Ocean Warming Modulates Pacific Climate Change” By Luo Et Al 2012

Filed under Climate Change Forcings & Feedbacks, Climate Models, Research Papers

Quotes From Peer Reviewed Paper That Document That Skillful Multi-Decadal Regional Climate Predictions Do Not Yet Exist

As I have posted on many times; e.g. see

The Huge Waste Of Research Money In Providing Multi-Decadal Climate Projections For The New IPCC Report

there is an enormous amount of money being spent to provide multi-decadal regional climate forecasts to the impacts communities. In this post, I select just a few quotes from peer reviewed papers to document that the climate models do not have this skill. There are more detailed on this post also (e.g. see).

As the first example, from

Dawson A., T. N. Palmer and S. Corti: 2012: Simulating Regime Structures in Weather and Climate Prediction Models. Geophyscial Research Letters. doi:10.1029/2012GL053284 In press.

We have shown that a low resolution atmospheric model, with horizontal resolution typical of CMIP5 models, is not capable of simulating the statistically significant regimes seen in reanalysis, …….It is therefore likely that the embedded regional model may represent an unrealistic realization of regional climate and variability.

Other examples, include

Taylor et al, 2012: Afternoon rain more likely over drier soils. Nature. doi:10.1038/nature11377. Received 19 March 2012 Accepted 29 June 2012 Published online 12 September 2012

“…the erroneous sensitivity of convection schemes demonstrated here is likely to contribute to a tendency for large-scale models to `lock-in’ dry conditions, extending droughts unrealistically, and potentially exaggerating the role of soil moisture feedbacks in the climate system.”

Driscoll, S., A. Bozzo, L. J. Gray, A. Robock, and G. Stenchikov (2012), Coupled Model Intercomparison Project 5 (CMIP5) simulations of climate following volcanic eruptions, J. Geophys. Res., 117, D17105, doi:10.1029/2012JD017607. published 6 September 2012.

The study confirms previous similar evaluations and raises concern for the ability of current climate models to simulate the response of a major mode of global circulation variability to external forcings.

Fyfe, J. C., W. J. Merryfield, V. Kharin, G. J. Boer, W.-S. Lee, and K. von Salzen (2011), Skillful predictions of decadal trends in global mean surface temperature, Geophys. Res. Lett.,38, L22801, doi:10.1029/2011GL049508

”….for longer term decadal hindcasts a linear trend correction may be required if the model does not reproduce long-term trends. For this reason, we correct for systematic long-term trend biases.”

Xu, Zhongfeng and Zong-Liang Yang, 2012: An improved dynamical downscaling method with GCM bias corrections and its validation with 30 years of climate simulations. Journal of Climate 2012 doi: http://dx.doi.org/10.1175/JCLI-D-12-00005.1

”…the traditional dynamic downscaling (TDD) [i.e. without tuning) overestimates precipitation by 0.5-1.5 mm d-1…..The 2-year return level of summer daily maximum temperature simulated by the TDD is underestimated by 2-6°C over the central United States-Canada region.”

Anagnostopoulos, G. G., Koutsoyiannis, D., Christofides, A., Efstratiadis, A. & Mamassis, N. (2010) A comparison of local and aggregated climate model outputs with observed data. Hydrol. Sci. J. 55(7), 1094–1110

“…. local projections do not correlate well with observed measurements. Furthermore, we found that the correlation at a large spatial scale, i.e. the contiguous USA, is worse than at the local scale.”

Stephens, G. L., T. L’Ecuyer, R. Forbes, A. Gettlemen, J.‐C. Golaz, A. Bodas‐Salcedo, K. Suzuki, P. Gabriel, and J. Haynes (2010), Dreary state of precipitation in global models, J. Geophys. Res., 115, D24211, doi:10.1029/2010JD014532.

“…models produce precipitation approximately twice as often as that observed and make rainfall far too lightly…..The differences in the character of model precipitation are systemic and have a number of important implications for modeling the coupled Earth system …….little skill in precipitation [is] calculated at individual grid points, and thus applications involving downscaling of grid point precipitation to yet even finer‐scale resolution has little foundation and relevance to the real Earth system.”

Sun, Z., J. Liu, X. Zeng, and H. Liang (2012), Parameterization of instantaneous global horizontal irradiance at the surface. Part II: Cloudy-sky component, J. Geophys. Res., doi:10.1029/2012JD017557, in press.

“Radiation calculations in global numerical weather prediction (NWP) and climate models are usually performed in 3-hourly time intervals in order to reduce the computational cost. This treatment can lead to an incorrect Global Horizontal Irradiance (GHI) at the Earth’s surface, which could be one of the error sources in modelled convection and precipitation. …… An important application of the scheme is in global climate models….It is found that these errors are very large, exceeding 800 W m-2 at many non-radiation time steps due to ignoring the effects of clouds….”

Ronald van Haren, Geert Jan van Oldenborgh, Geert Lenderink, Matthew Collins and Wilco Hazeleger, 2012: SST and circulation trend biases cause an underestimation of European precipitation trends Climate Dynamics 2012, DOI: 10.1007/s00382-012-1401-5

“To conclude, modeled atmospheric circulation and SST trends over the past century are significantly different from the observed ones. These mismatches are responsible for a large part of the misrepresentation of precipitation trends in climate models. The causes of the large trends in atmospheric circulation and summer SST are not known.”

As reported in

Kundzewicz, Z. W., and E.Z. Stakhiv (2010) Are climate models “ready for prime time” in water resources managementapplications, or is more research needed? Editorial. Hydrol. Sci. J. 55(7), 1085–1089.

they conclude that

“Simply put, the current suite of climate models were not developed to provide the level of accuracy required for adaptation-type analysis.”

Unless the NSF, Linda Mearns and her co-authors, ect can refute these peer reviewed findings, if they continue to ignore these studies and persist in presenting their multi-decadal climate predictions to the impacts communities, they are failing to serve as objective scientists. I wholeheartedly endorse the assessment of multi-decadal predictability. The papers I list earlier in this post as excellent examples of quality science in this context

However, providing predictions (i.e. projections/forecasts) to the impacts communities and policymakers, in which they are claimed to be skillful, is not a robust scientific endeavor.

I also add, this issue is independent of the debate as to the importance of CO2, and other human climate forcings, on the regional climate in coming decades. It means, however, that providing regional multi-decadal predictions is not only without a demonstrated skill, but is misleading the impact and policy communities as to what are the actual risks that we face.

Comments Off on Quotes From Peer Reviewed Paper That Document That Skillful Multi-Decadal Regional Climate Predictions Do Not Yet Exist

Filed under Climate Models, Climate Science Misconceptions

New Paper “Simulating Regime Structures In Weather And Climate Prediction Models” By Dawson Et Al 2012

Ryan Maue has alerted us to a new paper

Dawson A., T. N. Palmer and S. Corti: 2012: Simulating Regime Structures in Weather and Climate Prediction Models. Geophyscial Research Letters. doi:10.1029/2012GL053284 In press.

This paper further documents the gross inadequacies of the CMIP5 model runs as I have summarized, for example, in my posts

The Hindcast Skill Of The CMIP Ensembles For The Surface Air Temperature Trend” By Sakaguchi Et Al 2012

More CMIP5 Regional Model Shortcomings

CMIP5 Climate Model Runs – A Scientifically Flawed Approach

See also my post on a 2008 paper by Tim Palmer

Comments On The Article By Palmer et al. 2008 “Toward Seamless Prediction: Calibration of Climate Change Projections Using Seasonal Forecasts”

and my BAMS comment on his paper (and a related one by Jim Hurrell)

Pielke Sr., R.A., 2010: Comments on “A Unified Modeling Approach to Climate System Prediction”. Bull. Amer. Meteor. Soc., 91, 1699–1701, DOI:10.1175/2010BAMS2975.1,

The abstract of the Dawson et al 2012 GRL paper reads [highlight added]

It is shown that a global atmospheric model with horizontal resolution typical of that used in operational numerical weather prediction is able to simulate non-gaussian probability distributions associated with the climatology of quasi-persistent Euro-Atlantic weather regimes. The spatial patterns of these simulated regimes are remarkably accurate. By contrast, the same model, integrated at a resolution more typical of current climate models, shows no statistically significant evidence of such non-gaussian regime structures, and the spatial structure of the corresponding clusters are not accurate. Hence, whilst studies typically show incremental improvements in first and second moments of climatological distributions of the large-scale flow with increasing model resolution, here a real step change in the higher-order moments is found. It is argued that these results have profound implications for the ability of high resolution limited-area models, forced by low resolution global models, to simulate reliably, regional climate change signals.

Examples of key excerpts read

This paper presents a study of the ability of a state-of-the-art global atmospheric model, integrated in atmosphere-only mode at two different horizontal resolutions representative of NWP and climate models, to simulate Euro-Atlantic regime structures as found in reanalysis datasets. It is shown that whilst the NWP resolution model simulates the regimes well, the same model integrated at climate resolution has no statistically significant regimes at all.

This study supports the growing recognition that there is no more complex problem in computational science than that of simulating climate, and next generation climate simulators should be developed at current NWP resolutions – the need for Earth System complexity and ensemble capability notwithstanding.

We have shown that a low resolution atmospheric model, with horizontal resolution typical of CMIP5 models, is not capable of simulating the statistically significant regimes seen in reanalysis, yet a higher resolution configuration of the same model simulates regimes realistically. This result suggests that current projections of regional climate change may be questionable. This finding is also highly relevant to regional climate modelling studies where lower resolution global atmospheric models are often used as the driving model for high resolution regional models. If these lower resolution driving models do not have enough resolution to realistically simulate regimes, then then boundary conditions provided to the regional climate model could be systematically erroneous. It is therefore likely that the embedded regional model may represent an unrealistic realization of regional climate and variability.

This is a very convincing refutation of the claims in the Mears et al 2012 paper

Linda O. Mearns, Ray Arritt, Sébastien Biner, Melissa S. Bukovsky, Seth McGinnis, Stephan Sain, Daniel Caya, James Correia, Jr., Dave Flory, William Gutowski, Eugene S. Takle, Richard Jones, Ruby Leung, Wilfran Moufouma-Okia, Larry McDaniel, Ana M. B. Nunes, Yun Qian, John Roads, Lisa Sloan, Mark Snyder, 2012: The North American Regional Climate Change Assessment Program: Overview of Phase I Results. Bull. Amer.Met Soc. September issue. pp 1337-1362.

that I posted on in

Comment Submitted To BAMS On The Mearns Et Al 2012 Paper

Follow Up On My E-Mail Request To Linda Mearns Of NCAR

E-Mail To Linda Mearns On The 2012 BAMS Article On Dynamic Downscaling

“The North American Regional Climate Change Assessment Program: Overview of Phase I Results” By Mearns Et Al 2012 – An Excellent Study But It Overstates Its Significance In The Multi-Decadal Prediction Of Climate

As a final comment, the Dawson et al 2012 also confirms what I wrote in a paper in 1991

Pielke, R.A., 1991: Overlooked scientific issues in assessing hypothesized  greenhouse gas warming. Environ. Software, 6, 100-107.

It is the recommendation, as I wrote in that paper with the title

INABILITY FOR GCM MODELS TO PROPERLY RESOLVE THE EVOLUTION OF EXTRATROPICAL AND TROPICAL CYCLONES DUE TO THEIR POOR SPATIAL RESOLUTION

with the text

The horizontal grid spacing of general circulation models is around 400 km. As shown by Pielke (1984), as least four grid increments are required to reasonably represent an atmospheric feature, thus this grid resolution would only permit features 1600 km or larger to be reasonably represented in the models, Since extratropical cyclones often are observed to have horizontal wavelengths as small as 500 km or so, they are poorly represented in these models, Since these features provide the major physical mechanism for the exchange of heat, moisture, and momenlum between the subtropics and the polar regions, the inability of GCM representations to adequately represent these exchanges is a serious shortcoming. Tropical cyclones, which also provide an important mechanism for exchanges between the tropics and higher latitude is even more poorly represented since its scales of important physical processes includes the eye wall which can be tens of kilometers in radial size. Pielke (1988) discusses this shortcoming further.

Pielke, R.A., 1984: Mesoscale meteorological modeling. Academic Press, New York, N.Y., 612 pp.

Pielke, R.A., 1988: Evaluation of climate change using numerical models. In “Monitoring Climate for the Effects of Increasing Greenhouse Gas Concentrations. Proceedings of a Workshop”. R.A.
Pielke and T. Kittel, Eds., Cooperative Institute for Research in lhe Almosphere (CIRA),

source of image

Comments Off on New Paper “Simulating Regime Structures In Weather And Climate Prediction Models” By Dawson Et Al 2012

Filed under Climate Models, Research Papers

Follow Up On My E-Mail Request To Linda Mearns Of NCAR

source of image from the NARCCAP website

Last week I posted twice on the BAMS article

Linda O. Mearns, Ray Arritt, Sébastien Biner, Melissa S. Bukovsky, Seth McGinnis, Stephan Sain, Daniel Caya, James Correia, Jr., Dave Flory, William Gutowski, Eugene S. Takle, Richard Jones, Ruby Leung, Wilfran Moufouma-Okia, Larry McDaniel, Ana M. B. Nunes, Yun Qian, John Roads, Lisa Sloan, Mark Snyder, 2012: The North American Regional Climate Change Assessment Program: Overview of Phase I Results. Bull. Amer.Met Soc. September issue. pp 1337-1362.

in

“The North American Regional Climate Change Assessment Program: Overview of Phase I Results” By Mearns Et Al 2012 – An Excellent Study But It Overstates Its Significance In The Multi-Decadal Prediction Of Climate

E-Mail To Linda Mearns On The 2012 BAMS Article On Dynamic Downscaling

I have had an e-mail response from Linda Mearns and she informed me that she is too busy to respond at this time. I have requested her permission to post her e-mails rejecting my request and will present if she gives me permission.

Quite frankly, I am disappointed as ignoring the issues that I summarized in my two posts is not the proper approach to advancing climate science.

I have succinctly summarized below what are the fundamental flaws in the use of regional downscaling with respect to multi-decadal climate predictions:

My Conclusions:

  • The  Mearns et al 2012 BAMS paper with respect to type 2 downscaling it is an important new contribution.
  • However, it’s application to climate change runs (type 4 downscaling) is inappropriate and misleading to the impacts and policy communities.

In order to refute the second conclusion, these following two questions must be answered in the affirmative:

1. Can a type 4 downscaling can be more accurate than a type 2 downscaling? Otherwise why not just start from regional reanalyses and assess what changes would have to occur in order to cause a negative impact to key resources, as we recommed in Pielke et al 2012.  Only then assess what is plausibly possible and how to mitigate/adapt to prevent a negative effect from occuring.

2. Have the regional climate models shown skill  in predicting changes over time in regional multi-decadal regional climate statistics?

My answer to both #1 and #2 are NO.

The  Mearns et al 2012 BAMS paper uses observed data, as processed through reanalyses, as lateral boundary conditions, and interior nudging when used. This provides a real world constraint on how much the regional model can diverge from reality. This is why we label it as type 2 downscaling.

The results of the Mearns et al 2012 BAMS paper cannot be used to justify providing changes in climate statistics to the impacts communities (i.e. through type 4 downscaling).

The actual ability of climate models to predict (in hindcast) EVEN the current climate is very limited. I documented this with a number of peer-reviewed papers in my posts

More CMIP5 Regional Model Shortcomings

CMIP5 Climate Model Runs – A Scientifically Flawed Approach.

The Hindcast Skill Of The CMIP Ensembles For The Surface Air Temperature Trend –  By Sakaguchi Et Al 2012.

Predicting “climate change” is  even more of a challenge. The climate models have shown NO skill at predicting CHANGES in regional climate statistics.

It may be convenient to ignore these issues in order to keep the grant and contract money flowing, but unless these fundamental flaws can be refuted, research money and time is being wastefully spent.

Comments Off on Follow Up On My E-Mail Request To Linda Mearns Of NCAR

Filed under Climate Models, Climate Science Misconceptions

E-Mail To Linda Mearns On The 2012 BAMS Article On Dynamic Downscaling

source of image from Linda Mearns website

With respect to my post

“The North American Regional Climate Change Assessment Program: Overview of Phase I Results” By Mearns Et Al 2012 – An Excellent Study But It Overstates Its Significance In The Multi-Decadal Prediction Of Climate

I have sent the lead author, Linda Mearns, the e-mail below [and copied to her other co-authors and to several other colleagues who work on downscaling]. I will post her reply, if I receive one and have her permission.

Subject: Your Septmeber 2012 BAMS

Hi Linda

I read with considerable interest your paper

Linda O. Mearns, Ray Arritt, Sébastien Biner, Melissa S. Bukovsky, Seth McGinnis, Stephan Sain, Daniel Caya, James Correia, Jr., Dave Flory, William Gutowski, Eugene S. Takle, Richard Jones, Ruby Leung, Wilfran Moufouma-Okia, Larry McDaniel, Ana M. B. Nunes, Yun Qian, John Roads, Lisa Sloan, Mark Snyder, 2012: The North American Regional Climate Change Assessment Program: Overview of Phase I Results. Bull. Amer.Met Soc. September issue. pp 1337-1362.

It is a very much needed, effective analysis of the level of regional dynamic downscaling skill when forced by reanalyses. In

Castro, C.L., R.A. Pielke Sr., and G. Leoncini, 2005: Dynamical downscaling: Assessment of value retained and added using the Regional Atmospheric Modeling System (RAMS). J. Geophys. Res. – Atmospheres, 110, No. D5, D05108, doi:10.1029/2004JD004721.

and summarized in

Pielke Sr., R.A., and R.L. Wilby, 2012: Regional climate downscaling . what’s the point? Eos Forum, 93, No. 5, 52-53, doi:10.1029/2012EO050008.

Pielke, R. A., Sr., R. Wilby,  D. Niyogi, F. Hossain, K. Dairuku,J. Adegoke, G. Kallos, T. Seastedt, and K. Suding (2012), Dealing with complexity and extreme events using a bottom-up, resource-based vulnerability perspective, in Extreme Events and Natural Hazards: The Complexity Perspective, Geophys. Monogr. Ser., vol. 196, edited by A. S. Sharma et al. 345.359, AGU, Washington, D. C., doi:10.1029/2011GM001086. [copy available from https://pielkeclimatesci.files.wordpress.com/2011/05/r-365.pdf]

you are evaluating the skill and value-added of Type 2 downscaling.

However, you are misleading the impacts communities by indicating that your results apply to regional climate change (i.e. Type 4 downscaling).

I have posted on my weblog today

“The North American Regional Climate Change Assessment Program: Overview of Phase I Results” By Mearns Et Al 2012 – An Excellent Study But It Overstates Its Significance In The Multi-Decadal Prediction Of Climate

which is critical of how you present the implications of your findings.

As you wrote at the end

The Mearns et al 2012 study concludes with the claim that

“Our goal was to provide an overview of the relative performances of the six models both individually and as an ensemble with regard to temperature and precipitation. We have shown that all the models can simulate aspects of climate well, implying that they all can provide useful information about climate change. In particular, the results from phase I of NARCCAP will be used to establish uncertainty due to boundary conditions as well as final weighting of the models for the development of regional probabilities of climate change.”

You write

“We have shown that all the models can simulate aspects of climate well, implying that they all can provide useful information about climate change.”

What you have actually accomplished (and it is significant) is document the upper bound in terms of simulation skill of value-added to reanalyses using dynamic downscaling. However, you have not shown how this study provides skillful information in terms of changes in regional climate statistics on multi-decadal time scales.

I would like to post on my weblog a response from you (and your co-authors if they would like to) that responds to my comments. I will also post this e-mail query.

I have also copied this e-mail to other of our colleagues who are working on dynamic downscaling.

With Best Regards

Roger

Comments Off on E-Mail To Linda Mearns On The 2012 BAMS Article On Dynamic Downscaling

Filed under Climate Models, Research Papers

“The North American Regional Climate Change Assessment Program: Overview of Phase I Results” By Mearns Et Al 2012 – An Excellent Study But It Overstates Its Significance In The Multi-Decadal Prediction Of Climate

There is a new paper

Linda O. Mearns, Ray Arritt, Sébastien Biner, Melissa S. Bukovsky, Seth McGinnis, Stephan Sain, Daniel Caya, James Correia, Jr., Dave Flory, William Gutowski, Eugene S. Takle, Richard Jones, Ruby Leung, Wilfran Moufouma-Okia, Larry McDaniel, Ana M. B. Nunes, Yun Qian, John Roads, Lisa Sloan, Mark Snyder, 2012: The North American Regional Climate Change Assessment Program: Overview of Phase I Results. Bull. Amer.Met Soc. September issue. pp 1337-1362.

that provides further documentation of the level of skill of dynamic downscaling. It is a very important new contribution which will be widely cited. The participants in the North American Regional Climate Change Assessment Program  are listed here.

However, it significantly overstates the significance of its findings in terms of its application to the multi-decadal prediction of regional climate.

The paper is even highlighted on the cover of the September 2012 issue of BAMS, with the caption for the cover in the Table of Contents that reads

“Regional models are the foundation of research and services as planning for climate change requires more specific information than can be provided by global models. The North American Regional Climate Change Assessment Programs (Mearns et al., page 1337) evaluates uncertainties in using such models….”

Actually, as outlined below, the Mearns et al 2012 paper, while providing valuable new insight into one type of regional dynamic downscaling, is misrepresenting what these models can skillfully provide with respect to “climate change”.

The study uses observational data (from a Reanalysis) to drive the regional models. Using the classification we have introduced in our papers (see below), this is a type 2 dynamic downscaling study.

The Mearns et al 2012 paper only provides an upper bound of what is possible with respect to their goal to provide

uncertainties in regional scale projections of future climate and produce high resolution climate change scenarios using multiple regional climate models (RCMs) nested within atmosphere ocean general circulation models (AOGCMs) forced with the A2 SRES scenario.”

The type of downscaling used in a study is a critically important point that needs to be emphasized when dynamic downscaling studies are presented.  Indeed, the new paper seeks to just replicate the current climate, NOT changes in climate statistics over the time period of the model runs.

It is even more challenging to skillfully predict CHANGES in regional climate which is what is required if the RCMs are to add any value for predicting climate in the coming decades.

The abstract and their short capsule reads [highlight added]

The North American Regional Climate Change Assessment Program is an international effort designed to investigate the uncertainties in regional scale projections of future climate and produce high resolution climate change scenarios using multiple regional climate models (RCMs) nested within atmosphere ocean general circulation models (AOGCMs) forced with the A2 SRES scenario, with a common domain covering the conterminous US, northern Mexico, and most of Canada. The program also includes an evaluation component (Phase I) wherein the participating RCMs, with a grid spacing 50 km, are nested within 25 years of NCEP/DOE global reanalysis II.

We provide an overview of our evaluations of the Phase I domain-wide simulations focusing on monthly and seasonal temperature and precipitation, as well as more detailed investigation of four sub-regions. We determine the overall quality of the simulations, comparing the model performances with each other as well as with other regional model evaluations over North America.  The metrics we use do differentiate among the models, but, as found in previous studies, it is not possible to determine a ‘best’ model among them. The ensemble average of the six models does not perform best for all measures, as has been reported in a number of global climate model studies. The subset ensemble of the 2 models using spectral nudging is more often successful for domain wide root mean square error (RMSE), especially for temperature. This evaluation phase of NARCCAP will inform later program elements concerning differentially weighting the models for use in producing robust regional probabilities of future climate change.

Capsule

This article presents overview results and comparisons with observations for temperature and precipitation from the six regional climate models used in NARCCAP driven by NCEP/DOE Reanalysis II (R2) boundary conditions for 1980 through 2004.

Using the types of dynamic downscaling that we present in the articles

Castro, C.L., R.A. Pielke Sr., and G. Leoncini, 2005: Dynamical downscaling:  Assessment of value retained and added using the Regional Atmospheric  Modeling System (RAMS). J. Geophys. Res. – Atmospheres, 110, No. D5, D05108,  doi:10.1029/2004JD004721.

Pielke Sr., R.A., and R.L. Wilby, 2012: Regional climate downscaling – what’s the point? Eos Forum,  93, No. 5, 52-53, doi:10.1029/2012EO050008.

the Mearns et al 2012 paper is a Type 2 downscaling. It provides an upper bound on the skill possible from Type 3 and Type 4 downscaling, since real world observations are used to constrain the model simulations (through the lateral boundary conditions, and from interior nudging if used).

These types of downscaling are defined in the Castro et al 2005 and Pielke and Wilby 2012 papers as

Type 1 downscaling is used for short-term, numerical weather prediction. In dynamic type 1 downscaling the regional model includes initial conditions from observations. In type 1 statistical downscaling the regression relationships are developed from observed data and the type 1 dynamic model predictions.

Type 2 dynamic downscaling refers to regional weather (or climate) simulations [e.g., Feser et al., 2011] in which the regional model’s initial atmospheric conditions are forgotten (i.e., the predictions do not depend on the specific initial conditions) but results still depend on the lateral boundary conditions from a global numerical weather prediction where initial observed atmospheric conditions are not yet forgotten or are from a global reanalysis. Type 2 statistical downscaling uses the regression relationships developed for type 1 statistical downscaling except that the input variables are from the type 2 weather (or climate) simulation. Downscaling from reanalysis products (type 2 downscaling) defines the maximum forecast skill that is achievable with type 3 and type 4 downscaling.

Type 3 dynamic downscaling takes lateral boundary conditions from a global model prediction forced by specified real world surface boundary conditions such as seasonal weather predictions based on observed sea surface temperatures, but the initial observed atmospheric conditions in the global model are forgotten [e.g., Castro et al., 2007]. Type 3 statistical downscaling uses the regression relationships developed for type 1 statistical downscaling except using the variables from the global model prediction forced by specified real-world surface boundary conditions.

Type 4 dynamic downscaling takes lateral boundary conditions from an Earth system model in which coupled interactions among the atmosphere, ocean, biosphere, and cryosphere are predicted [e.g., Solomon et al.,
2007]. Other than terrain, all other components of the climate system are calculated by the model except for human forcings, including greenhouse gas emissions scenarios, which are prescribed. Type 4 dynamic
downscaling is widely used to provide policy makers with impacts from climate decades into the future. Type 4 statistical downscaling uses transfer functions developed for the present climate, fed with large scale atmospheric information taken from Earth system models representing future climate conditions. It is assumed that statistical relationships between real-world surface observations and large-scale weather patterns will not change. Type 4 downscaling has practical value but with the very important caveat that it should be used for model sensitivity experiments and not as predictions [e.g., Pielke, 2002; Prudhomme et al., 2010].

Because real-world observational constraints diminish from type 1 to type 4 downscaling, uncertainty grows as more climate variables must be predicted by models, rather than obtained from observations.

The Mearns et al 2012 study concludes with the claim that

Our goal was to provide an overview of the relative performances of the six models both individually and as an ensemble with regard to temperature and precipitation. We have shown that all the models can simulate aspects of climate well, implying that they all can provide useful information about climate change. In particular, the results from phase I of NARCCAP will be used to establish uncertainty due to boundary conditions as well as final weighting of the models for the development of regional probabilities of climate change.

First, as documented in the article, the difference between  the models and the observations are actually significant. To claim that

“all the models can simulate aspects of climate well”

is not a robust claim.  What is meant by “well”?  The tables and figures in the article document significant biases in the temperatures and precipitation even for the current climate type 2 downscaling simulations.

Even more significantly, their type 2 downscaling study does NOT imply

“that they all can provide useful information about climate change”!

The  Mearns et al 2012 study did not look at the issue of their skill to predict CHANGES in climate statistics. For this they must examine type 4 downscaling skill, which they did not do.

In the context of the skill achieved with type 2 dynamic downscaling, this is an important, useful study.  However, to use the results of this type 2 downscaling study by Mearns et al 2012 to provide

“….final weighting of the models for the development of regional probabilities of climate change”

is a gross overstatement of what they accomplished. One cannot use type 2 downscaling to make claims about the accuracy of type 4 downscaling.

I am e-mailing the authors of the Mearns et al 2012 paper to request their response to my comments.  Each of them are well-respected colleagues and I will post their replies when they respond.

source of image

Comments Off on “The North American Regional Climate Change Assessment Program: Overview of Phase I Results” By Mearns Et Al 2012 – An Excellent Study But It Overstates Its Significance In The Multi-Decadal Prediction Of Climate

Filed under Climate Models, Climate Science Misconceptions, Research Papers

The Hindcast Skill Of The CMIP Ensembles For The Surface Air Temperature Trend” By Sakaguchi Et Al 2012

Figure caption: These maps show the observed (left) and model-predicted (right) air temperature trend from 1970 to 1999. The climate model developed by the National Center for Atmospheric Research (NCAR) is used here as an example. More than 50 such simulations were analyzed in the published study. (Illustration: Koichi Sakaguchi)

I was alerted to a new paper that examines the predictive skill of the multi-decadal global climate predictions; h/t to Anthony Watts in his post

Climate Models shown to be inaccurate less than 30 years out

Actually, the article also informs us on their value for even longer time periods,. The article is

Sakaguchi, K., X. Zeng, and M. A. Brunke (2012), The hindcast skill of the CMIP ensembles for the surface air temperature trend, J. Geophys. Res., 117, D16113, doi:10.1029/2012JD017765.

[as a side comment, Xubin Zeng was one of my Ph.d. students (and an outstanding one!) who I have published with, and I have also published with Mike Brunke].

The abstract reads [highlight added]

Linear trends of the surface air temperature (SAT) simulated by selected models from the Coupled Model Intercomparison Project (CMIP3 and CMIP5) historical experiments are evaluated using observations to document (1) the expected range and characteristics of the errors in hindcasting the ‘change’ in SAT at different spatiotemporal scales, (2) if there are ‘threshold’ spatiotemporal scales across which the models show substantially improved performance, and (3) how they differ between CMIP3 and CMIP5. Root Mean Square Error, linear correlation, and Brier score show better agreement with the observations as spatiotemporal scale increases but the skill for the regional (5° × 5° – 20° × 20° grid) and decadal (10 – ∼30-year trends) scales is rather limited. Rapid improvements are seen across 30° × 30° grid to zonal average and around 30 years, although they depend on the performance statistics. Rather abrupt change in the performance from 30° × 30° grid to zonal average implies that averaging out longitudinal features, such as land-ocean contrast, might significantly improve the reliability of the simulated SAT trend. The mean bias and ensemble spread relative to the observed variability, which are crucial to the reliability of the ensemble distribution, are not necessarily improved with increasing scales and may impact probabilistic predictions more at longer temporal scales. No significant differences are found in the performance of CMIP3 and CMIP5 at the large spatiotemporal scales, but at smaller scales the CMIP5 ensemble often shows better correlation and Brier score, indicating improvements in the CMIP5 on the temporal dynamics of SAT at regional and decadal scales.

The conclusions contain the informative caution

The spatiotemporal scales with more reliable model skills as identified in this study are consistent with previous studies [Randall et al., 2007] and suggest caution in directly using the outputs of long-term simulations for regional and decadal studies.

This is reminensent of the statement by Kevin Trenberth who wrote for Nature entitled

Predictions of climate

that

“…..we do not have reliable or regional predictions of climate.”

Clearly, the CMIP5 model results do not have the skill needed by the impacts communities either directly from the global model or dynamically or statistically downscaled on any multi-decadal time scales, as we summarized in our article

Pielke Sr., R.A., and R.L. Wilby, 2012: Regional climate downscaling – what’s the point? Eos Forum,  93, No. 5, 52-53, doi:10.1029/2012EO050008.

If they do not have sufficient skill for time periods less than 30 years for surface temperature, and longer time periods are made up of 30 years periods, they certainly will not have added skill at any multi-decadal time period. Moreover, since other climate metrics (e.g. precipitation) are even more difficult to predict, the lack of value of the CMIP5 model runs for the impacts communities is actually well (although subtlely) documented in the Sakaguchi et al 2o12 paper.

There is a major oversight, however, in the Sakaguchi et al 2o12 paper. This paper neglected to include available peer reviewed papers that document a serious lack of skill in the CMIP5 model runs. I have summarized these in my posts

Comments On The Nature Article “Afternoon Rain More Likely Over Drier Soils” By Taylor Et Al 2012 – More Rocking Of The IPCC Boat

More CMIP5 Regional Model Shortcomings

CMIP5 Climate Model Runs – A Scientifically Flawed Approach

By neglecting the peer reviewed papers I listed in those posts [most of which available to the authors], the Sakaguchi et al 2o12 even with its critical assessment of the CMIP3 and CMIP5 model predictive skill, has still not completely assessed the actual skill of the CMIP5 and CMIP3 model capabilities.

Comments Off on The Hindcast Skill Of The CMIP Ensembles For The Surface Air Temperature Trend” By Sakaguchi Et Al 2012

Filed under Climate Models, Research Papers

Guest Post By Robert Pollock On Global Climate Modeling

I was sent an informative e-mail by Robert Pollock on the global climate response to volacanic eruptions which I am presenting below with permission.  Robert is a retired physicist with training in radiation dosimetry.  He started a company to measure radon in the environment and sold it a few years ago.

His excellent set of information is presented below

On Tue, 11 Sep 2012, Robert Pollock wrote:

Roger, I don’t know if you have an interest in volcanic eruptions, but they are often cited as an example of the efficacy of GCMs and are very important when looking at ocean heat content.

Gleckler et al. modeled the effect of volcanic eruptions on ocean heat content. Using 12 climate models they showed that Krakatoa in 1883 made its presence felt well into the 20th century in the form of reduced sea level rise and less ocean warming (both on the surface and at depth). As stated in the AR4, including volcanic eruptions improved the model’s match to reality, and the cooling from volcanoes was offsetting a considerable fraction of anthropogenic ocean warming.

Figure 1 from Gleckler shows the difference with and without volcanic forcing between 1880 and 2000: www.nature.com/nature/journal/v439/n7077/fig_tab/439675a_F1.html

At the end of the 20th century simulations with (blue) and without (green) volcanic forcings have a difference of some 70% (18/60 10^22 J).

The authors wrote

“Inclusion of volcanic forcing from Krakatoa (and, by implication, from even earlier eruptions) is important for a reliable simulation of historical increases in ocean heat content and sea-level change due to thermal expansion.”

However, in a 2010 paper Gregory notes that ‘even earlier eruptions’ were not included in the Gleckler modeling work and if they had been, the conclusion would have been quite different. If an eruption produces a cooling and a drop of sea level rise that lasts decades (if not centuries) then each new eruption would lead to further decreases indefinitely.

Such is not the case, and Gregory modeled a steady-state condition resulting from earlier eruptions before Krakatoa. With other climate model the background natural conditions do not include volcanic eruptions. The impact of a new eruption (as part of a series) then becomes less and doesn’t lead to a long-term trend in ocean heat content.

Most GCMs overestimate the (depressive) effect of volcanoes and thus also overestimate the forcing from greenhouse gases to reproduce the climate and ocean heat content of the 20th century.

Gleckler et al. Volcanoes and climate: Krakatoa’s signature persists in the ocean www.nature.com/nature/journal/v439/n7077/abs/43975a.html

Gregory Long-term effect of volcanic forcing on ocean heat content www.agu.org/pubs/crossref/2010/2010GL045507.shtml

Driscoll et al. now have a paper in press that looks at the current generation of models used for the AR5 (13 CHIMP5 models) and their ability to model large tropical eruptions. The abstract lists a number of problems and

“raises concern for the ability of current climate models to simulate the response of a major mode of global circulation variability to external forcings. This is also of concern for the accuracy of geoengineering modeling studies that asses the atmospheric response to stratosphere-injection particles.”

Coupled Model Intercomparison Project 5 (CMIP5) simulations of climate following volcanic eruptions www.agu.org/pubs/crossref/pip/2012JD017607.shtml

Robert Pollock

source of image

Comments Off on Guest Post By Robert Pollock On Global Climate Modeling

Filed under Climate Change Forcings & Feedbacks, Climate Models

More CMIP5 Regional Model Shortcomings

source of image

In my post

CMIP5 Climate Model Runs – A Scientifically Flawed Approach

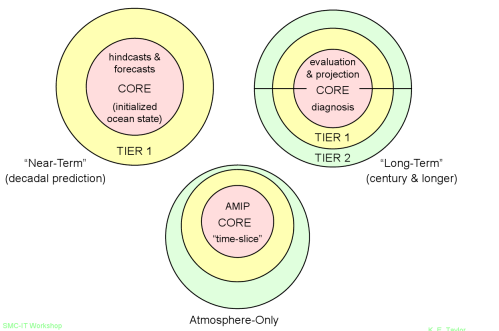
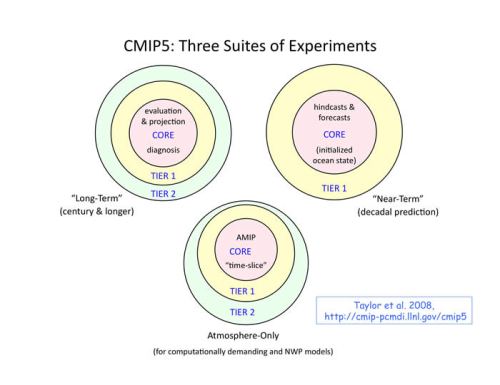
The CMIP5 – Coupled Model Intercomparison Project Phase 5 is an integral part of the upcoming IPCC assessment.  Two of its goals are to

  • evaluate how realistic the models are in simulating the recent past,
  • provide projections of future climate change on two time scales, near term (out to about 2035) and long term (out to 2100 and beyond)

In my post, CMIP5 Climate Model Runs – A Scientifically Flawed Approach, I presented a number of peer-reviewed model comparisons with real world observations that documents the failure of the multi-decadal global climate models to provide skillful regional climate predictions to the impacts communities.

I concluded my post with the text

These studies, and I am certain more will follow, show that the multi-decadal climate models are not even skillfully simulating current climate statistics, as are needed by the impacts communities, much less CHANGES in climate statistics.  At some point, this waste of money to make regional climate predictions decades from now is going to be widely recognized.

Jos de Laat of KNMI has provided us with further examples that document the serious limitation of the CMIP5 model results. I have presented this list below [with highlighting]. I am pleased that the model hindcast predictions are being reported, as this is clearly information that the impact and policy communities need.

L. Goddard, A. Kumar, A. Solomon, D. Smith, G. Boer, P. Gonzalez, V. Kharin, W. Merryfield, C. Deser, S. J. Mason, B. P. Kirtman, R. Msadek, R. Sutton, E. Hawkins, T. Fricker, G. Hegerl, C. A. T. Ferro, D. B. Stephenson, G. A. Meehl, T. Stockdale, R. Burgman, A. M. Greene, Y. Kushnir, M. Newman, J. Carton, I. Fukumori, T. Delworth. (2012) A verification framework for interannual-to-decadal predictions experiments. Climate Dynamics Online publication date: 24-Aug-2012.

Abstract

Decadal predictions have a high profile in the climate science community and beyond, yet very little is known about their skill. Nor is there any agreed protocol for estimating their skill. This paper proposes a sound and coordinated framework for verification of decadal hindcast experiments. The framework is illustrated for decadal hindcasts tailored to meet the requirements and specifications of CMIP5 (Coupled Model Intercomparison Project phase 5). The chosen metrics address key questions about the information content in initialized decadal hindcasts. These questions are: (1) Do the initial conditions in the hindcasts lead to more accurate predictions of the climate, compared to un-initialized climate change projections? and (2) Is the prediction model’s ensemble spread an appropriate representation of forecast uncertainty on average? The first question is addressed through deterministic metrics that compare the initialized and uninitialized hindcasts. The second question is addressed through a probabilistic metric applied to the initialized hindcasts and comparing different ways to ascribe forecast uncertainty. Verification is advocated at smoothed regional scales that can illuminate broad areas of predictability, as well as at the grid scale, since many users of the decadal prediction experiments who feed the climate data into applications or decision models will use the data at grid scale, or downscale it to even higher resolution. An overall statement on skill of CMIP5 decadal hindcasts is not the aim of this paper. The results presented are only illustrative of the framework, which would enable such studies. However, broad conclusions that are beginning to emerge from the CMIP5 results include (1) Most predictability at the interannual-to-decadal scale, relative to climatological averages, comes from external forcing, particularly for temperature; (2) though moderate, additional skill is added by the initial conditions over what is imparted by external forcing alone; however, the impact of initialization may result in overall worse predictions in some regions than provided by uninitialized climate change projections; (3) limited hindcast records and the dearth of climate-quality observational data impede our ability to quantify expected skill as well as model biases; and (4) as is common to seasonal-to-interannual model predictions, the spread of the ensemble members is not necessarily a good representation of forecast uncertainty. The authors recommend that this framework be adopted to serve as a starting point to compare prediction quality across prediction systems. The framework can provide a baseline against which future improvements can be quantified. The framework also provides guidance on the use of these model predictions, which differ in fundamental ways from the climate change projections that much of the community has become familiar with, including adjustment of mean and conditional biases, and consideration of how to best approach forecast uncertainty.

Driscoll, S., A. Bozzo, L. J. Gray, A. Robock, and G. Stenchikov (2012), Coupled Model Intercomparison Project 5 (CMIP5) simulations of climate following volcanic eruptions, J. Geophys. Res., 117, D17105, doi:10.1029/2012JD017607. published 6 September 2012.

Abstract

The ability of the climate models submitted to the Coupled Model Intercomparison Project 5 (CMIP5) database to simulate the Northern Hemisphere winter climate following a large tropical volcanic eruption is assessed. When sulfate aerosols are produced by volcanic injections into the tropical stratosphere and spread by the stratospheric circulation, it not only causes globally averaged tropospheric cooling but also a localized heating in the lower stratosphere, which can cause major dynamical feedbacks. Observations show a lower stratospheric and surface response during the following one or two Northern Hemisphere (NH) winters, that resembles the positive phase of the North Atlantic Oscillation (NAO). Simulations from 13 CMIP5 models that represent tropical eruptions in the 19th and 20th century are examined, focusing on the large-scale regional impacts associated with the large-scale circulation during the NH winter season. The models generally fail to capture the NH dynamical response following eruptions. They do not sufficiently simulate the observed post-volcanic strengthened NH polar vortex, positive NAO, or NH Eurasian warming pattern, and they tend to overestimate the cooling in the tropical troposphere. The findings are confirmed by a superposed epoch analysis of the NAO index for each model. The study confirms previous similar evaluations and raises concern for the ability of current climate models to simulate the response of a major mode of global circulation variability to external forcings. This is also of concern for the accuracy of geoengineering modeling studies that assess the atmospheric response to stratosphere-injected particles.

Mauritsen, T., et al. (2012), Tuning the climate of a global model, J. Adv. Model. Earth Syst., 4, M00A01, doi:10.1029/2012MS000154. published 7 August 2012.

Abstract

During a development stage global climate models have their properties adjusted or tuned in various ways to best match the known state of the Earth’s climate system. These desired properties are observables, such as the radiation balance at the top of the atmosphere, the global mean temperature, sea ice, clouds and wind fields. The tuning is typically performed by adjusting uncertain, or even non-observable, parameters related to processes not explicitly represented at the model grid resolution. The practice of climate model tuning has seen an increasing level of attention because key model properties, such as climate sensitivity, have been shown to depend on frequently used tuning parameters. Here we provide insights into how climate model tuning is practically done in the case of closing the radiation balance and adjusting the global mean temperature for the Max Planck Institute Earth System Model (MPI-ESM). We demonstrate that considerable ambiguity exists in the choice of parameters, and present and compare three alternatively tuned, yet plausible configurations of the climate model. The impacts of parameter tuning on climate sensitivity was less than anticipated.

Jiang, J. H., et al. (2012), Evaluation of cloud and water vapor simulations in CMIP5 climate models using NASA “A-Train” satellite observations, J. Geophys. Res., 117, D14105, doi:10.1029/2011JD017237. published 18 July 2012.

Using NASA’s A-Train satellite measurements, we evaluate the accuracy of cloud water content (CWC) and water vapor mixing ratio (H2O) outputs from 19 climate models submitted to the Phase 5 of Coupled Model Intercomparison Project (CMIP5), and assess improvements relative to their counterparts for the earlier CMIP3. We find more than half of the models show improvements from CMIP3 to CMIP5 in simulating column-integrated cloud amount, while changes in water vapor simulation are insignificant. For the 19 CMIP5 models, the model spreads and their differences from the observations are larger in the upper troposphere (UT) than in the lower or middle troposphere (L/MT). The modeled mean CWCs over tropical oceans range from ∼3% to ∼15× of the observations in the UT and 40% to 2× of the observations in the L/MT. For modeled H2Os, the mean values over tropical oceans range from ∼1% to 2× of the observations in the UT and within 10% of the observations in the L/MT. The spatial distributions of clouds at 215 hPa are relatively well-correlated with observations, noticeably better than those for the L/MT clouds. Although both water vapor and clouds are better simulated in the L/MT than in the UT, there is no apparent correlation between the model biases in clouds and water vapor. Numerical scores are used to compare different model performances in regards to spatial mean, variance and distribution of CWC and H2O over tropical oceans. Model performances at each pressure level are ranked according to the average of all the relevant scores for that level.

From the conclusions: “Tropopause layer water vapor is poorly simulated with respect to observations. This likely results from temperature biases.”

Sakaguchi, K., X. Zeng, and M. A. Brunke (2012), The hindcast skill of the CMIP ensembles for the surface air temperature trend, J. Geophys. Res., 117, D16113, doi:10.1029/2012JD017765. published 28 August 2012

Linear trends of the surface air temperature (SAT) simulated by selected models from the Coupled Model Intercomparison Project (CMIP3 and CMIP5) historical experiments are evaluated using observations to document (1) the expected range and characteristics of the errors in hindcasting the ‘change’ in SAT at different spatiotemporal scales, (2) if there are ‘threshold’ spatiotemporal scales across which the models show substantially improved performance, and (3) how they differ between CMIP3 and CMIP5. Root Mean Square Error, linear correlation, and Brier score show better agreement with the observations as spatiotemporal scale increases but the skill for the regional (5° × 5° – 20° × 20° grid) and decadal (10 – ∼30-year trends) scales is rather limited. Rapid improvements are seen across 30° × 30° grid to zonal average and around 30 years, although they depend on the performance statistics. Rather abrupt change in the performance from 30° × 30° grid to zonal average implies that averaging out longitudinal features, such as land-ocean contrast, might significantly improve the reliability of the simulated SAT trend. The mean bias and ensemble spread relative to the observed variability, which are crucial to the reliability of the ensemble distribution, are not necessarily improved with increasing scales and may impact probabilistic predictions more at longer temporal scales. No significant differences are found in the performance of CMIP3 and CMIP5 at the large spatiotemporal scales, but at smaller scales the CMIP5 ensemble often shows better correlation and Brier score, indicating improvements in the CMIP5 on the temporal dynamics of SAT at regional and decadal scales.

Comments Off on More CMIP5 Regional Model Shortcomings

Filed under Climate Models, Research Papers

Another Paper That Documents The Limitations Of Skillful Multi-Decadal Regional Climate Predictions “Urban Precipitation Extremes: How Reliable Are Regional Climate Models?” By Mishra Et Al 2012

I was alerted to another paper that documents the limitations of multi-decadal regional climate predictions [h/t Robert Pollock] .

The paper is

Mishra, V., F. Dominguez, and D. P. Lettenmaier (2012), Urban precipitation extremes: How reliable are regional climate models?, Geophys. Res. Lett., 39, L03407, doi:10.1029/2011GL050658.

The abstract reads [highlight added]

We evaluate the ability of regional climate models (RCMs) that participated in the North American Regional Climate Change Assessment Program (NARCCAP) to reproduce the historical season of occurrence, mean, and variability of 3 and 24-hour precipitation extremes for 100 urban areas across the United States. We show that RCMs with both reanalysis and global climate model (GCM) boundary conditions behave similarly and underestimate 3-hour precipitation maxima across almost the entire U.S. RCMs with both boundary conditions broadly capture the season of occurrence of precipitation maxima except in the interior of the western U.S. and the southeastern U.S. On the other hand, the RCMs do much better in identifying the season of 24-hour precipitation maxima. For mean annual precipitation maxima, regardless of the boundary condition, RCMs consistently show high (low) bias for locations in the western (eastern) U.S. Our results indicate that RCM-simulated 3-hour precipitation maxima at 100-year return period could be considered acceptable for stormwater infrastructure design at less than 12% of the 100 urban areas (regardless of boundary conditions). RCM performance for 24-hour precipitation maxima was slightly better, with performance acceptable for stormwater infrastructure design judged adequate at about 25% of the urban areas.

Their experimental design is explained as

We used RCM-simulated precipitation output from participating models in the North American Regional Climate Change Assessment Program (NARCCAP) [Mearns et al., 2009]. For most of the NARCCAP RCMs, two distinct simulations were made: the first simulation forced the RCMs with output from the National Center for Environmental Prediction/Department of Energy (NCEP/DOE) reanalysis [Kanamitsu et al., 2002] at the boundaries for the 1979–2000 period (RCM-reanalysis henceforth). For the second simulation, output from selected GCMs was used to provide the RCM boundary conditions both in the historical (1968–2000) and future (2038–2080) periods (RCM-GCM henceforth). In this study, we focus only on the RCM reanalysis and RCM-GCM for the historical period, because our objective is to evaluate model skill when compared to observations.

Thus, the downscaling runs using the Reanalysis is a Type 2 downscaling as defined in

Castro, C.L., R.A. Pielke Sr., and G. Leoncini, 2005: Dynamical downscaling:  Assessment of value retained and added using the Regional Atmospheric  Modeling System (RAMS). J. Geophys. Res. – Atmospheres, 110, No. D5, D05108,  doi:10.1029/2004JD004721.

The runs with the GCMs for the period 1968-2000 appears to be a Type 3 downscaling (i.e. the SSTs are prescribed over this time period, but their paper is not clear on this).  If SSTs, and all other aspects of the GCM runs were predicted, not prescribed, this would be a Type 4 downscaling simulation run in a hindcast  mode.

Their conclusions include the summary

1. RCM performance is satisfactory in simulating the seasonality of 24-hour precipitation extremes across most of the U.S. However, for most urban areas in the western and southeastern U.S., the seasonality of 3-hour precipitation extremes was not successfully reproduced by the RCMs with either reanalysis or GCM boundary conditions. Specifically, the RCMs tended to predict 3-hour precipitation maxima in winter, whereas the observations indicated summer.
2. RCMs largely underestimated 3-hour precipitation maxima means and 100-year return period magnitudes at most locations across the United States for both reanalysis and GCM boundary conditions. However, performance was better for 24-hour precipitation maxima (means and 100-year events), although there were generally overestimates in the west, and underestimates in the east.
3. For both 3 and 24-hour annual precipitation maxima, RCMs with reanalysis boundary conditions underestimated interannual variability and overestimated interannual variability with GCM boundary conditions.
4. At only a very small number of locations was the bias in RCM-simulated 3 and 24-hour 100 year return period precipitation maxima within +/-10% of the observed estimates, which might be deemed acceptable for stormwater infrastructure design purposes.

This is an informative study. Using reanalyses, where real-world observations are used to constrain the regional climate model predictions (through later boundary conditions and nudging), provides the benchmark upon which the multi-decadal climate forecasts must improve on.

Papers that we have completed on extreme rainfall events in urban areas; e. g.

Lei, M., D. Niyogi, C. Kishtawal, R. Pielke Sr., A. Beltrán-Przekurat, T. Nobis, and S. Vaidya, 2008: Effect of explicit urban land surface representation on the simulation of the 26 July 2005 heavy rain event over Mumbai, India. Atmos. Chem. Phys. Discussions, 8, 8773–8816.

show that landscape effects must also be considered in planning for extreme rainfall events.

See also for Atlanta, research on this subject by Marshall Shepherd and by Dev Niyogi

Atlanta Thunderstorms by J. Marshall Shepherd

News Report On The Role of Landscape Processes On Weather and Climate

The Mishra et al 2012 paper shows that participating models in the North American Regional Climate Change Assessment Program (NARCCAP) have not provided evidence that their predictions would have the required skill for the future time period  (2038–2080).

They have biases  for the recent climate, and have not even been tested in this paper with respect to their ability to skillfully predict changes in urban climate statistics over the period 1968 to 2000.  If they are being provided to urban planners as being robust estimates of the envelope of what could occur during 2038-2080, they are misleading those policymakers.

source of image

Comments Off on Another Paper That Documents The Limitations Of Skillful Multi-Decadal Regional Climate Predictions “Urban Precipitation Extremes: How Reliable Are Regional Climate Models?” By Mishra Et Al 2012

Filed under Climate Models, Research Papers