Monthly Archives: May 2010

How Independent Are Climate Models?

There is an excellent guest post by Ryan Meyer on May 27 2010  on my son’s weblog titled

The Significance of Climate Model Agreement: A Guest Post by Ryan Meyer

The post is based on their paper

Zachary Pirtle, Ryan Meyer, , and Andrew Hamilton, 2010: What does it mean when climate models agree? A case for assessing independence among general circulation models . Environmental Science & Policy. doi:10.1016/j.envsci.2010.04.004

The abstract of their paper reads

“Climate modelers often use agreement among multiple general circulation models (GCMs) as a source of confidence in the accuracy of model projections. However, the significance of model agreement depends on how independent the models are from one another. The climate science literature does not address this. GCMs are independent of, and interdependent on one another, in different ways and degrees. Addressing the issue of model independence is crucial in explaining why agreement between models should boost confidence that their results have basis in reality.”

I want to expand on this issue in this post.

As the Pirtle et al 2010 article discusses, agreement among models is often used to claim robustness in their predictions. However, it is actually quite easy to show that the model are actually very similar in their construction, and only differ in the details of how they are set up.

I decompose atmospheric models in my book

Pielke, R.A., Sr., 2002: Mesoscale meteorological modeling. 2nd Edition, Academic Press, San Diego, CA, 676 pp.

While the focus is on mesoscale atmospheric models, the set up for the atmospheric component of climate models uses the same framework.  These models have:

  • a fundamental physics part  which are the pressure gradient force, advection and gravity. There are no tunable constants or functions.
  • the remainder are parameterized physics (parameterized physics means that even if some of the equations of a physics formulation is used, tunable constants and functions inlcuded that are based on observations and/or more detailed models). These parameterizations are almost developed using  just a subset of actual real world conditions with the one-dimensional (column) representations yet then applied in the climate models for all situations!  The parameterized physics in the atmospheric model include long- and short-wave radiative fluxes; stratiform clouds and precipitation; deep cumulus cloud and associated precipitation; boundary layer turbulence; land-air interactions; ocean-air interactions).

The other components of the climate system (ocean, land, continental ice) each also have parameterized physics. The ocean component also has the fundamental physics of the pressure gradient force, advection and gravity.

All of the climate models  have this framework. They differ  in the grid spacing used, the numerical solution techniques, and the details of their parameterized physics.  The different results that they achieve are due just to these differences.

These models are also different from numerical weather prediction models. These NWP models are initialized with observed data. The predictions for different time periods into the future are compared with the observations at those time periods in order to evaluate prediction skill. The multi-decadal climate models, however, are not started from such observed real world initial conditions. Only recently has it proposed to run climate models in this manner; the so-called “seamless prediction” approach – see the post on this

Seamless Prediction Systems by Hendrik Tennekes

Comments On The Article By Palmer et al. 2008 “Toward Seamless Prediction: Calibration of Climate Change Projections Using Seasonal Forecasts”

There is further discussion of what the multi-decadal climate models involve in my post

Are Multi-Decadal Global Climate Simulations Hypotheses? Have They Been Tested, and, If So, Have the Hypotheses As Represented By the Models, Been Falsified?

In this post, there is an interesting statement by one of the lead authors on the WG1 IPCC report (David A. Randall) in an 1997 Bulletin of the American Meteorological Society paper:

“Measurements, Models, and Hypotheses in the Atmospheric Sciences” by David A. Randall, and Bruce A. Wielicki.

The abstract of the paper states,

‘Measurements in atmospheric science sometimes determine universal functions, but more commonly data are collected in the form of case studies. Models are conceptual constructs that can be used to make predictions about the outcomes of measurements. Hypotheses can be expressed in terms of model results, and the best use of measurements is to falsify such hypotheses. Tuning of models should be avoided because it interferes with falsification. Comparison of models with data would be easier if the minimum data requirements for testing some types of models could be standardized.”

Roy Spencer also has an  post on this topic titled

The Missing Climate Model Projections

Among his insightful comments, he writes

“Where the IPCC has departed from science is that they have become advocates for one particular set of hypotheses, and have become militant fighters against all others.”

What this means is that multi-decadal  climate model predictions are just hypotheses. They can only be falsified by comparison with observed data which, of course, will not be available until these decades have passed.  Thus they are not only constructed with similar frameworks, but their predictive skill cannot yet even be tested.

Thus the real question regarding the climate models is how different are they in terms of what they really are –  scientific hypotheses. A start to answering this question is i) by  determining what climate forcings and feedbacks they leave out and ii) a comparison between each model of the specific details in (a) the fundamental physics part and (b) parameterizations of each physical, chemical and biological component of the models. 

What is already known, of course, is that all of the climate models have similar formulations and only differ in the details of the numerical solution scheme, grid mesh used and of the parameterizations.

Comments Off on How Independent Are Climate Models?

Filed under Climate Models

Comment On Real Climate’s Post By Gavin Schmidt – “Ocean Heat Content Increases Update”

There is a post by Gavin Schmidt  on Real Climate on May 21 2010 titled “Ocean heat content increases update” .

Gavin, unfortunately, does not comment about and question the odd jump in the warming earlier in the current decade that is seen in the plot of upper ocean heat data, the Lyman et al 2010 paper, and which he presents in his post. Indeed, the greater warming in the Lyman et al 2010 paper that he accepts unquestionably [which he writes is  “a greater warming than seen in the NODC data and more than even the models”] is due specifically to a short-term jump. Since this is the time that the Argo Network finally achieved global coverage the reason for this jump needs more exploration. However, this jump is not seen in the sea surface temperature data (see from Bob Tisdale’s weblog).

Here is Josh Willis’s response to my query to him on this jump, which is reproduced from my post of December 29 2009 titled

Comment From Josh Willis On The Upper Ocean Heat Content Data Posted On Real Climate

The text of this post is

Real Climate has a post titled  Updates to model-data comparisons which includes a plot of the variations in upper ocean content anomalies from the period 1955 through 2009 .  

I asked Josh Willis the following with respect to the plot in the Real Climate post

My question:

Real Climate has posted a plot of ocean heat content, which we have
 discussed before, that shows a sudden jump in the 2002-2003 time frame;

 http://www.realclimate.org/index.php/archives/2009/12/updates-to-model-data-comparisons/

 This jump is not seen it other metrics, including the surface temperatures
 (which they show) or the lower tropospheric temperatures (e.g. see

 see Figure 7 TLT

 http://www.ssmi.com/msu/msu_data_description.html.

 Can you comment on the realism of this jump? Would you be willing to let me
 post your reply, if you do comment?

 Most of their trend agreement with the models is due to this single jump.

Josh Willis’s reply [reproduced with his permission]

There is still a good deal of uncertainty in observational estimates of ocean heat content during the 1990s and into the early part of the 2000s. This is because of known biases in the XBT data set, which are the dominant source of ocean temperature data up until 2003 or 2004. Numerous authors have attempted to correct these biases, but substantial difference remain in the “corrected” data.  As a result, the period from 1993 to 2003 still has uncertainties that are probably larger than the natural or anthropogenic signals in ocean heat content that happen over a period of 1 to 3 years.  However, the decadal trend of 10 to 15 years seems to be large enough to see despite the uncertainties. Because Argo begins to become the dominant source of temperature data in about 2004, the period from 2000 to 2005 is especially worriesome because of the transition from an XBT-dominated estimate of ocean heat content.

You might also comment that there is another easily available estimate besides that of Levitus et al. (the one shown in this blog entry).  The other long-term estimate is from Domingues et al. and can be downloaded from CSIRO:

http://www.cmar.csiro.au/sealevel/sl_data_cmar.html

 What Gavin is also ignoring in his post is that  the rate of  heating has flattened since 2004 even in the Lyman et al 2010 paper. The NODC data even shows cooling.  This is the “missing heat” that Keven Trenberth has discussed (see).

This failure for Gavin to comment on other perspectives is evident in one of the comments on his post. There is an informative comment on May 24 2010 by Alex Harvey which reads

Gavin #60,

I am still left with the impression that you are evading the question of the meaning and significance of the Pielke/Willis/Trenberth exchange.

We all know, of course, Trenberth’s now famous behind the scenes remark that it is a travesty that we can’t account for the lack of recent global warming, and his exclamation that the observing system must be inadequate (which I guess is reference to the satellite radiation budget measurements?). Trenberth later claimed that there is heat missing and that it must lie beneath >700m in the deep ocean and that it may come back “to haunt us”. But Willis then agreed with Pielke that it is probably impossible and that it’s unlikely we’ll find any missing heat below 700m. Pielke Jr spelt it out for us the next day that this means the “missing heat” is probably missing because it has been radiated out into space, or in layman’s terms, because it’s just not there.

Now a few weeks later we find ocean heat has been adjusted upwards by Lyman et al. and we find Josh Willis one of the coauthors. Yet Willis already agreed that he thought the existing measurements were pretty good. Pielke has used Willis’s data to show a decline in OHC since 2003 which doesn’t appear in this the new Lyman et al analysis. (In fact, it looks like Willis has frankly got his own name on two of the curves in your diagram, both the NODC data and the Lyman et al data. Is that right?)

So what is the conclusion for this? There is missing heat below 700M or there isn’t?

Best, Alex

[Response: There is clearly some heating going on below 700m. But this discussion of ‘missing’ heat is very confused. The satellite records are not good enough to say what the year-to-year imbalance is and so are not able to say whether any heat is missing or not. So what is the ‘missing’ idea based on? Model estimates – but as I showed above, the estimates of OHC change are in line with the models, and so I don’t see why anyone thinks that any heat is missing. If the satellite data were better, there might be something to this, but right now the issues are all in the noise, and thus pretty unresolvable. – gavin]

What Gavin does not comment on is that the upper ocean heat data is a more robust metric to diagnose the global average radiative imbalance than the estimates of the radiative fluxes from satellites. This was shown as early as in the paper

Ellis et al. 1978: The annual variation in the global heat balance of the Earth. J. Climate. 83, 1958-1962

 I discussed the consequences in terms of diagnosing the radiative forcing in

Pielke Sr., R.A., 2003: Heat storage within the Earth system. Bull. Amer. Meteor. Soc., 84, 331-335.

Gavin also ignores the excellent paper

Douglass, D.H. and R. Knox, 2009: Ocean heat content and Earth’s radiation imbalance. Physics letters A.

What Gavin Schmidt has done is to present an uncritical assessment of the Lyman et al 2010 paper without questioning the robustness of its findings. I am pleased that at least one commenter on Real Climate recognized  (and was permitted to post) this lack of scientific balance in Gavin’s post.

Comments Off on Comment On Real Climate’s Post By Gavin Schmidt – “Ocean Heat Content Increases Update”

Filed under Climate Change Metrics

Excellent Post On The Economist On Water As “The World’s Most Valuable Stuff”

In the May 22 2010 issue of the Economist, there is an excellent article titled

The world’s most valuable stuff 

with the subheading

“Mostly because of farming, water is increasingly scarce. Managing it better could help”

This article effectively presents the vulnerability view that is consistent with what we urged in our paper

Pielke Sr., R., K. Beven, G. Brasseur, J. Calvert, M. Chahine, R. Dickerson, D. Entekhabi, E. Foufoula-Georgiou, H. Gupta, V. Gupta, W. Krajewski, E. Philip Krider, W. K.M. Lau, J. McDonnell,  W. Rossow,  J. Schaake, J. Smith, S. Sorooshian,  and E. Wood, 2009: Climate change: The need to consider human forcings besides greenhouse gases. Eos, Vol. 90, No. 45, 10 November 2009, 413. Copyright (2009) American Geophysical Union

where we wrote

“The impact on water quality and water quantity, for example, is a critically important societal concern. The water cycle is among the most significant components of the climate system and involves, for example, cloud radiation, ice albedo, and land use feedbacks [NRC, 2003]. Regional and local variations in water availability, water quality, and hydrologic extremes (floods and droughts) affect humans most directly.”

We recommend that the next assessment phase of the IPCC (and other such assessments) broaden its perspective to include all of the human climate forcings. It should also adopt a complementary and precautionary resource- based assessment of the vulnerability of critical resources (those affecting water, food, energy, and human and ecosystem health) to environmental variability and change of all types.

and

“We ….. propose that one should not rely solely on prediction as the primary policy approach to assess the potential impact of future regional and global climate variability and change. Instead, we suggest that integrated assessments within the framework of vulnerability, with an emphasis on risk assessment and disaster prevention, offer a complementary approach [Kabat et al., 2004].”

as well as in posts on my weblog; e.g. see where I wrote

“There are 5 broad areas that we can use to define the need for vulnerability assessments : water, food, energy, health and ecosystem function. Each area has societally critical resources. The vulnerability concept requires the determination of the major threats to these resources from climate, but also from other social and environmental issues. After these threats are identified for each resource, then the relative risk from natural- and human-caused climate change (estimated from the GCM projections, but also the historical, paleo-record and worst case sequences of events) can be compared with other risks in order to adopt the optimal mitigation/adaptation strategy.”

The Economist article includes the perceptive and very important text

“Nature has decreed that the supply of water is fixed. Meanwhile demand rises inexorably as the world’s population increases and enriches itself. Homes, factories and offices are sucking up ever more. But it is the planet’s growing need for food (and the water involved in producing crops and meat) that matters most. Farming accounts for 70% of withdrawals.”

“Although the supply of water cannot be increased, mankind can use what there is better—in four ways. One is through the improvement of storage and delivery, by creating underground reservoirs, replacing leaking pipes, lining earth-bottomed canals, irrigating plants at their roots with just the right amount of water, and so on. A second route focuses on making farming less thirsty—for instance by growing newly bred, perhaps genetically modified, crops that are drought-resistant or higher-yielding. A third way is to invest in technologies to take the salt out of sea water and thus increase supply of the fresh stuff. The fourth is of a different kind: unleash the market on water-users and let the price mechanism bring supply and demand into balance. And once water is properly priced, trade will encourage well-watered countries to make water-intensive goods, and arid ones to make those that are water-light.”

“Even if the world manages to limit depletion, many water-related problems will persist. About 1 billion people are still without access to a decent water supply, while others suffer from flooding, pollution and poor sanitation. Yet if man wants to solve these problems, he can. He has applied far more money and know-how to issues far less important than the shortage of water. And if he does tackle them successfully, the big causes of human suffering—disease and poverty—will be automatically alleviated. Investing more thought and cash in the better use of the world’s most valuable commodity is surely worthwhile.”

The entire article is worth reading!

Comments Off on Excellent Post On The Economist On Water As “The World’s Most Valuable Stuff”

Filed under Vulnerability Paradigm

Excellent Posts On The Weblog Of Bob Tisdale On Near Real-Time Ocean Surface Temperature Anomalies

In my post

Lack Of A Trend In The Ocean Surface Temperature Since 2000 – Its Significance

I wrote

“What is missing from the otherwise excellent website (refering to website http://www.osdpd.noaa.gov/ml/ocean/sst/anomaly.html), of course, are time plots of the global average sea surface temperatures, as well as averages for different subregions of the oceans.  With that information, we could more readily track the ocean contribution to the global average surface temperature trend, as well as anomalies within the subregions.”

Bob Tisdale on his weblog http://bobtisdale.blogspot.com/ has alerted us to his excellent weblog presentation with monthly updates of SST anomalies globally, and for hemispheric and ocean basin basins. His information is accessible at

http://bobtisdale.blogspot.com/2010/05/april-2010-sst-anomaly-update.html

The global average anomaly is currently well above average, but unless this positive anomaly continues for the coming months, the absence of a clear long term trend since 1998 remains (although the interannual variations are remarkably large).

As Bob writes

“NINO3.4 SST anomalies are dropping but El Niño conditions remained during April in the central tropical Pacific (Monthly NINO3.4 SST Anomaly = +0.68 deg C). Weekly data has fallen into ENSO-neutral ranges (+0.30 deg C). Global SST anomalies increased slightly again during April (0.017 deg C). On a hemispheric basis, the rise was limited basically to the Northern Hemisphere, since the increase in the Southern Hemisphere was negligible (0.002 deg C). And looking at the major ocean basins, the North Pacific, South Atlantic, Indian Ocean, and the East Indian-West Pacific Ocean datasets all show drops this month, but they were not strong enough to outweigh the rises in the North Atlantic and South Pacific.”

Bob also provides mid-month updates of NINO3.4 and global data using the weekly OI.v2 SST anomaly data, aka Reynolds SST data at http://bobtisdale.blogspot.com/2010/05/mid-may-2010-sst-anomaly-update.html. He writes

“NINO3.4 SST anomalies for the week centered on May 19, 2010 show that central equatorial Pacific SST anomalies are below zero and continuing their decline. Presently they’re at -0.21 deg C, which is in ENSO-neutral levels.”

and

 “Weekly Global SST anomalies are still elevated, but they may have peaked for this El Nino. They are starting to show signs of a drop in response to the decline in central equatorial Pacific temperatures, but the global weekly data is much too variable to tell for sure.”

I recommend bookmarking this excellent, much needed weblog!

Comments Off on Excellent Posts On The Weblog Of Bob Tisdale On Near Real-Time Ocean Surface Temperature Anomalies

Filed under Climate Change Metrics

Lack Of A Trend In The Ocean Surface Temperature Since 2000 – Its Significance

In the Lyman et al 2010 paper [that I have discussed in two posts; see and see], there is the interesting statement that

“…sea surface temperatures have been roughly constant since 2000…”

This finding is based on the section of the paper State of the Climate in 2008 by Peterson and Baringer (2009) titled

Knight, J. et al. Global oceans: do global temperature trends over the last decade falsify climate predictions? Bull. Am. Meteorol. Soc. 90, S56–S57 (2009).

Figure 3.4 top  in this article is presumably the data  that Lyman et al 2010 are referring to. The tropical ocean average anomalies in Figure 3.4 5th figure also shows an absence of further warming since 1998 although, as with the global average, it remains above the long term average (1950 to 2008).

There are important consequences of this lack of a continued global average ocean surface temperature increase:

  • since an increase of atmospheric water vapor is required to amplify the radiative heating from added CO2 and other human inputs of greenhouse gases, the absence of continued ocean surface warming suggests this water vapor feedback to radiative forcing is more muted than predicted by the IPCC multi-decadal model predictions. This more muted response in the real world  is consistent with what has been reported in the study De-Zheng Sun, Yongqiang Yu, and Tao Zhang, 2009: Tropical Water Vapor and Cloud Feedbacks in Climate Models: A Further Assessment Using Coupled Simulations Journal of Climate, Volume 22, Issue 5 (March 2009) pp. 1287–1304.
  • The claims that warming is continuing  (e.g. see) is, therefore, based on the land portion of the surface temperature record  [warm equatorial ocean temperature anomalies in recent years, particularly in the Atlantic, are offset elsewhere in the ocean].  With respect to the land surface temperature trends, we have documented a warm bias as we report in our paper Klotzbach, P.J., R.A. Pielke Sr., R.A. Pielke Jr., J.R. Christy, and R.T. McNider, 2009: An alternative explanation for differential temperature trends at the surface and in the lower troposphere. J. Geophys. Res., 114, D21102, doi:10.1029/2009JD011841.

Of course, as I and others, including Kevin Trenberth, have repeatedly urged (e.g. see and see) we need to move to the use of the ocean heat content change as the metric to assess global warming and cooling. Ocean heat content changes provide a much more robust metric than surface temperature trends as the metric to assess global warming and cooling (e.g. see and see).

A further assessment of the ocean surface temperature trends is available from the excellent website http://www.osdpd.noaa.gov/ml/ocean/sst/anomaly.html.

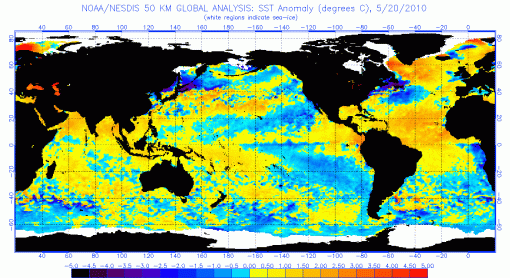
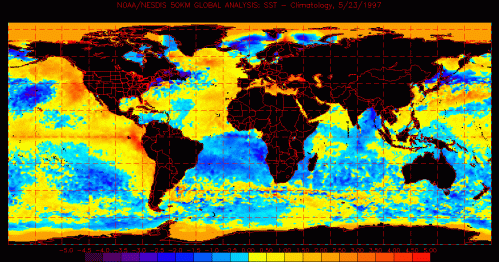
I have presented two analyses of ocean surface temperature anomalies below; one for mid May 2010 (top) and one for mid May 1997 (bottom). The format has changed and the center point of geography is different (which makes it harder to compare the two figures], but what stands out is not a clear difference in the ocean average, but the remarkably large spatial variations in the anomalies. It is these anomalies that have a much greater effect on the climate that society and the environment experience (e.g. drought, floods, hurricanes, etc) than a global average trend (which has not even been evident for several years).

What is missing from the otherwise excellent website, of course, are time plots of the global average sea surface temperatures, as well as averages for different subregions of the oceans.  With that information, we could more readily track the ocean contribution to the global average surface temperature trend, as well as anomalies within the subregions.

Comments Off on Lack Of A Trend In The Ocean Surface Temperature Since 2000 – Its Significance

Filed under Climate Change Metrics

My Perspective On The Nature Commentary By Kevin Trenberth

As readers of my weblog know, there are a set of posts giving e-mails among Kevin Trenberth, Josh Willis and I, and blog posts by Roy Spencer, on the issue of “missing heat” in the climate system. These posts can be viewed at

Is There “Missing” Heat In The Climate System? My Comments On This NCAR Press Release

Further Feedback From Kevin Trenberth And Feedback From Josh Willis On The UCAR Press Release

Comments On Two Papers By Kevin Trenberth On The Global Climate Energy Budget

The Significance of the E-Mail Interchange with Kevin Trenberth and Josh Willis

Article On The “Missing Heat” In The April 16 Issue of Physicsworld.com

Further Comment By Kevin Trenberth

Roy Spencer’s Response To Kevin Trenberth, April 26, 2009

April 26 2010 Reply By Kevin Trenberth

Earths Missing Energy: Trenberth’s Plot Proves My Point

There is now a new contribution by Kevin on Nature (it is actually not new in one sense, since Kevin (and J. Fasullo) recently posted a commentary on the same subject at Science magazine. Nature soliciting the same person (no matter how qualified) to write a comment is not expanding our perspective on this issue (Roy Spencer, for example, would have been a good choice as he has a different viewpoint than Kevin expressed in his Science comment).

The Nature comment is

Kevin E. Trenberth, 2010: The ocean is warming, isn’t it? Nature 465, 304-304 (19 May 2010) doi:10.1038/465304a News and Views

The abstract reads

“A reappraisal of the messy data on upper-ocean heat content for 1993–2008 provides clear evidence for warming. But differences among various analyses and inconsistencies with other indicators merit attention.”

The Trenberth commentary is in response to the paper (which I posted on this past Friday; see)

John M. Lyman, Simon A. Good, Viktor V. Gouretski, Masayoshi Ishii, Gregory C. Johnson, Matthew D. Palmer, Doug M. Smith, Josh K. Willis, 2010: Robust warming of the global upper ocean. Nature 465, 334-337 (20 May 2010) doi:10.1038/nature09043 Letter

The abstract of the Lyman et al paper reads

A large (~1023 J) multi-decadal globally averaged warming signal in the upper 300 m of the world’s oceans was reported roughly a decade ago and is attributed to warming associated with anthropogenic greenhouse gases. The majority of the Earth’s total energy uptake during recent decades has occurred in the upper ocean, but the underlying uncertainties in ocean warming are unclear, limiting our ability to assess closure of sea-level budgets, the global radiation imbalance and climate models. For example, several teams have recently produced different multi-year estimates of the annually averaged global integral of upper-ocean heat content anomalies (hereafter OHCA curves) or, equivalently, the thermosteric sea-level rise. Patterns of interannual variability, in particular, differ among methods. Here we examine several sources of uncertainty that contribute to differences among OHCA curves from 1993 to 2008, focusing on the difficulties of correcting biases in expendable bathythermograph (XBT) data. XBT data constitute the majority of the in situ measurements of upper-ocean heat content from 1967 to 2002, and we find that the uncertainty due to choice of XBT bias correction dominates among-method variability in OHCA curves during our 1993–2008 study period. Accounting for multiple sources of uncertainty, a composite of several OHCA curves using different XBT bias corrections still yields a statistically significant linear warming trend for 1993–2008 of 0.64 W m-2 (calculated for the Earth’s entire surface area), with a 90-per-cent confidence interval of 0.53–0.75 W m-2.

Unfortunately, Kevin (nor the Lyman et al paper which includes Josh Willis as one of the co-authors)  includes any of the discussion in the e-mails that I posted where there is no evidence of significant heat being accumulated in recent years at depths lower than 700m. However, Kevin does acknowledge a “slowdown since 2003” of heating.

Kevin’s statement

“Moreover, methods of analysis and interpolation of gaps in space and time should take account of the warming climate, and care is needed not to bias results towards background values”

however, is puzzling as it implies that heat has to be added to the analysis even if it is not directly measured! The background (i.e. measured values) are what should be used.

While it is unfortunate that he did not use the Nature commentary to include the perspective that Josh Willis provided to him in the e-mail exchanges and Roy Spencer provided in his blog posts, Kevin does agree with us that

“More robust indicators of a warming planet come from evidence of increasing ocean heat content and associated sea-level rise.”

and

“As the relevant analytical methods mature, ocean heat content is likely to become a key indicator of climate change.”

Both of these conclusions are what I proposed in my paper

Pielke Sr., R.A., 2003: Heat storage within the Earth system. Bull. Amer. Meteor. Soc., 84, 331-335

where the abstract reads

“The assessment of heat storage and its changes over time should be a focus of international climate monitoring programs.”

with the conclusion reading

In conclusion, there are several major reasons that the assessment of the earth system’s heat budget is so valuable.

• The earth’s heat budget observations, within the limits of their representativeness and accuracy, provide an observational constraint on the radiative forcing imposed in retrospective climate modeling.

• A snapshot at any time documents the accumulated heat content and its change since the last assessment. Unlike temperature, at some specific level of the ocean, land, or the atmosphere, in which there is a time lag in its response to radiative forcing, there are no time lags associated with heat changes.

• Since the surface temperature is a two-dimensional global field, while heat content involves volume integrals, as shown by Eq. (1), the utilization of surface temperature as a monitor of the earth system climate change is not particularly useful in evaluating the heat storage changes to the earth system. The heat storage changes, rather than surface temperatures, should be used to determine what fraction of the radiative fluxes at the top of the atmosphere are in radiative equilibrium. Of course, since surface temperature has such an important impact on human activities, its accurate monitoring should remain a focus of climate research (Pielke et al. 2002a).”

There is also an interesting statement in the Lyman et al 2010 paper

“…sea surface temperatures have been roughly constant since 2000…”

which I will discuss further in an upcoming post since this means any global average surface temperature increase since 2000 must have occurred on land (yet, as we have seen (e.g. see), there is a warm bias in the land surface temperature trend assessments presented by NCDC, GISS and CRU).

Comments Off on My Perspective On The Nature Commentary By Kevin Trenberth

Filed under Climate Science Reporting

A New Paper “Global Warming Advocacy Science: A Cross Examination” By Jason Scott Johnston

A very important, much needed new research paper has appeared. It is

Global Warming Advocacy Science: A Cross Examination by Jason Scott Johnston who is the Robert G. Fuller, Jr. Professor of Law and Director, Program on Law, Environment and Economy of the University of Pennsylvania – Law School.

His short biographical vita reads

“Jason Scott Johnston has published dozens of articles in American law journals, such as the Yale Law Journal,and in peer-reviewed economics journals, such as the Journal of Law, Economics and Organization. He is currently working on books about the law and economics, corporate environmentalism, global warming policy, and the comparative law and economics of environmental federalism. He has served on the Board of Directors of the American Law and Economics Association and on the National Science Foundation’s Law and Social Science grant review panel. He won Penn Law’s Robert A. Gorman Award for Teaching Excellence in 2003.”

The abstract reads

Legal scholarship has come to accept as true the various pronouncements of the Intergovernmental Panel on Climate Change (IPCC) and other scientists who have been active in the movement for greenhouse gas (ghg) emission reductions to combat global warming. The only criticism that legal scholars have had of the story told by this group of activist scientists – what may be called the climate establishment – is that it is too conservative in not paying enough attention to possible catastrophic harm from potentially very high temperature increases.

This paper departs from such faith in the climate establishment by comparing the picture of climate science presented by the Intergovernmental Panel on Climate Change (IPCC) and other global warming scientist advocates with the peer-edited scientific literature on climate change. A review of the peer-edited literature reveals a systematic tendency of the climate establishment to engage in a variety of stylized rhetorical techniques that seem to oversell what is actually known about climate change while concealing fundamental uncertainties and open questions regarding many of the key processes involved in climate change. Fundamental open questions include not only the size but the direction of feedback effects that are responsible for the bulk of the temperature increase predicted to result from atmospheric greenhouse gas increases: while climate models all presume that such feedback effects are on balance strongly positive, more and more peer-edited scientific papers seem to suggest that feedback effects may be small or even negative. The cross-examination conducted in this paper reveals many additional areas where the peer-edited literature seems to conflict with the picture painted by establishment climate science, ranging from the magnitude of 20th century surface temperature increases and their relation to past temperatures; the possibility that inherent variability in the earth’s non-linear climate system, and not increases in CO2, may explain observed late 20th century warming; the ability of climate models to actually explain past temperatures; and, finally, substantial doubt about the methodological validity of models used to make highly publicized predictions of global warming impacts such as species loss.

Insofar as establishment climate science has glossed over and minimized such fundamental questions and uncertainties in climate science, it has created widespread misimpressions that have serious consequences for optimal policy design. Such misimpressions uniformly tend to support the case for rapid and costly decarbonization of the American economy, yet they characterize the work of even the most rigorous legal scholars. A more balanced and nuanced view of the existing state of climate science supports much more gradual and easily reversible policies regarding greenhouse gas emission reduction, and also urges a redirection in public funding of climate science away from the continued subsidization of refinements of computer models and toward increased spending on the development of standardized observational datasets against which existing climate models can be tested.

Keywords: Climate change, greenhouse effect, ghg emission reductions, catastrophic risk, comparative scientific analysis, open scientific questions, size and direction of feedback effects, inherent non-linear temperature changes, methodological validity of climate models, gradual and reversible policy choices.

Comments Off on A New Paper “Global Warming Advocacy Science: A Cross Examination” By Jason Scott Johnston

Filed under Climate Science Reporting, Research Papers

Update On Jim Hansen’s Forecast Of Global Warming As Diagnosed By The Upper Ocean Heat Content Change

Jim Hansen responded in 2005 to a comment we made on ocean heat content with respect to a Science Express article he wrote in that year [Pielke and Christy, 2005; our Comment was (no surprise) rejected by Science]. Jim’s entire 2005 response can be read here.

“Contrary to the claim of Pielke and Christy, our simulated ocean heat storage (Hansen et al., 2005) agrees closely with the observational analysis of Willis et al. (2004). All matters raised by Pielke and Christy were considered in our analysis and none of them alters our conclusions.

The Willis et al. measured heat storage of 0.62 W/m2 refers to the decadal mean for the upper 750 m of the ocean. Our simulated 1993-2003 heat storage rate was 0.6 W/m2 in the upper 750 m of the ocean. The decadal mean planetary energy imbalance, 0.75 W/m2, includes heat storage in the deeper ocean and energy used to melt ice and warm the air and land. 0.85 W/m2 is the imbalance at the end of the decade.”

With the new 2010 paper

John M. Lyman, Simon A. Good, Viktor V. Gouretski, Masayoshi Ishii, Gregory C. Johnson, Matthew D. Palmer, Doug M. Smith, Josh K. Willis, 2010: Robust warming of the global upper ocean. Nature 465, 334-337 (20 May 2010) doi:10.1038/nature09043 Letter

we can update how well Jim Hansen’s prediction is comparing to observations. My last update was on February 9 2009 [I have a post on Keven Trenberth’s commentary on the Lyman et al paper on Monday].

The Lyman et al 2010 paper concludes that 

“Accounting for multiple sources of uncertainty, a composite of several OHCA curves using different XBT bias corrections still yields a statistically significant linear warming trend for 1993–2008 of 0.64W per meter squared (calculated for the Earth’s entire surface area), with a 90-per-cent confidence interval of 0.53–0.75 W per meter squared.”

The 1993 to 2008 value is close to the Hansen prediction despite the flattening of the heating of the upper ocean reported in the Lyman et al 2010 paper since 2003 [if we use Jim Hansen’s expected radiative imbalance at the end of the 1990s of 0.85 Watts per meter squared and use  80% of that to represent the upper ocean heat content change, his prediction of the heating rate of the upper ocean is 0.68 Watts per meter squared. This is within the uncertainty of the Lyman et al analysis].

However, there are important questions with respect to conclusion of Jim Hansen’s forecast as well as an opportunity.  First, since the heating rate is dominated by the time period prior to 2004, an assessment of whether the GISS model (which is the basis of Jim’s forecast) produces interruptions of the heating for this long needs to be made and reported. Also, over 40% of the heating occurred in just the time period 2002 and 2003 with about 30% more in 1999.  Does the GISS model predict such shorter term bursts of heating?

With respect tot the lack of recent heating, the Lyman et al 2010 paper write

“The individual OHCA curves all flatten out after around 2003, with some variability among curves in the year in which this levelling occurs. The causes of this flattening are unclear, but sea surface temperatures have been roughly constant since 2000. Although sea level has continued to rise steadily during this period, an increase in the amount of water added to the ocean by melting continental ice in recent years may account for most of this rise even with very little change in ocean heat content….The flattening of OHCA curves also occurs around the time (2004) that the Argo array of autonomous profiling floats first achieved near global coverage and became the primary source of OHCA data.”

A consequence of this absence of heating is that we should soon see a return to the radiative imbalance predicted by Jim Hansen, if he is correct. Indeed, this provides us the best opportunity we have over the next few years to test the robustness of the  multi-decadal global models to predict the climate system radiative imbalance (i.e. global warming).

Comments Off on Update On Jim Hansen’s Forecast Of Global Warming As Diagnosed By The Upper Ocean Heat Content Change

Filed under Climate Change Metrics

Climate Change: The West vs The Rest by Will Alexander

We are fortunate to have a guest post by Will Alexander (see his earlier one here). WJR (Will) Alexander is Professor Emeritus of the Department of Civil Engineering of the University of Pretoria, South Africa, and Honorary Fellow of the South African Institution of Civil Engineering. He spent the past 35 years of his career actively involved in the development of water resource and flood analysis methods as well as in natural disaster mitigation studies. His interest in climate change arose from claims that it would have an adverse effect in these fields. In his subsequent studies of very large hydrometeorological data sets he was unable to detect any adverse human-related changes. He has written more than 200 papers, presentations and books on these subjects. [alexwjr@iafrica.com]

GUEST POST By Will Alexander

Disarray

Climate change is presently in a position of total disarray. The credibility of many scientists and their institutions is at risk. It is not difficult to identify the origin of the problem.

The G20 and G8 nations are due to meet in Canada during June. The United Nations Secretary General visited Canada during May. His mission was to convince the Canadian Prime Minister to elevate climate change above the global economic crisis to the top of their agenda. The request was refused. This was an amazing request.

The global financial crisis is adversely affecting the livelihoods of many millions of people across the world. It has its origins in the financial mismanagement of the Western nations. What the Secretary General, his advisers and the Western nations failed to realise is that this whole climate change charade has its origins in a decision made by the G8 nations at a meeting at Glen Eagles, Scotland in June 2005. This is what happened.

The international academies of science produced a document: Joint science academies statement: global response to climate change. It was addressed to the G8 nations’ summit meeting. The signatories accepted the IPCC’s assessment reports of 2001, and then made further recommendations.

I draw your attention to its comments that adaptation to climate change required worldwide collaborative inputs from a wide range of experts, including physical and natural scientists, engineers, social scientists, medical scientists, those in the humanities, business leaders and economists. [ This recommendation was ignored.]

Also note the following important paragraph.

Work with developing nations to build a scientific and technological capacity suited to the circumstances, enabling them to develop innovative solutions to mitigate and adapt to the adverse effects of climate change, while explicitly recognizing their legitimate development rights. (My emphasis). [This recommendation was also flagrantly ignored. In the years that followed all nations of the world, east and west, rich and poor, were expected to follow this suicidal path.]

The Stern Review

The academies’ recommendations to the G8 nations resulted in the appointment of Nicholas Stern, a British senior civil servant and economist to review the whole climate change issue and make recommendations. After his appointment he called for submissions.

I responded to his request. On 24 November 2005 I submitted my 92-page technical report An assessment of the likely consequences of global warming on the climate of South Africa as well as my United Nations commissioned report Risk and society — an African perspective. They were ignored.

On 20 February 2006 I responded to another call for comments. It was ignored as were my subsequent e-mails of 5 March and 13 April. I protested and offered to come to the United Kingdom and address a meeting of experts of his choice. It was also ignored. The original correspondence and my reports should be available in the archives of the Stern Review. Note the following passage in my e-mail of 13 April in particular.

Current climate change theory and the conclusions drawn from it are seriously in error. Governments that accept the IPCC’s position should be aware of this. They should also carefully consider the sociological, economic and political consequences should they undertake costly and economically restrictive measures that are subsequently found to be based on erroneous science. Climate change scientists should also be aware of the potential harm to tens of millions of the poor and disadvantaged people of the world should their recommendations be implemented and later found to be in error. They should also consider the risks to their reputations and to those of science and scientists in general. I’m very confident of my conclusions.

Alas, these predictions have come to pass.

The brief notes below illustrate one of the many examples in my report to the Stern Review that completely demolishes the alarmist predictions by climate change scientists as described in the IPCC’s assessment reports.

The fourth assessment report was published in segments during 2007. The following sentence was published in the report. The same view was also expressed in earlier assessment reports.

The human activity on climate in this era greatly exceeds that due to known changes in natural processes, such as solar changes and volcanic eruptions.

This single statement lies at the very core of the whole climate change charade.

Solar linkage

In the 1850s British astronomers reported the linkage between sunspot numbers and famines in India. In 1889 D.E. Hutchins published his book Cycles of drought and good seasons in South Africa. He based his analyses on data from the Royal Observatory in Cape Town that was established in 1842. In the 1960s through to the 1980s engineering hydrologists became increasingly concerned about the unexplained variability present in many hydrological records. In the 1960s there were already references to the receipt and poleward redistribution of solar energy as the probable driver of these variations. I was directly involved in international discussions on these serious hydrological anomalies from 1970 onwards.

Over the years I produced approximately 3 GB of calculations, technical reports and refereed publications on this subject. One of these was my extended summary report that I submitted to the Stern Review in November 2005. My report was titled An assessment of the likely consequences of global warming on the climate of South Africa. It had 92 pages, 15 figures, 13 tables, and 50 references. I was aware of the requirements expressed by the international academies of science at that time. My report was directly relevant to the recommendations by the academies.

The essence of my report was that after three years of study of a comprehensive hydrometeorological database, I could find no evidence of unexplained variations in the data. It became increasingly obvious that the anomalies were the consequence of variations in the receipt and poleward redistribution of solar energy.

Subsequently my reports and papers were targeted at South African readers. I had lost all faith in material published by Western authors in the light of my experience with the Stern Review. It was impossible to determine the nature of material that was deliberately omitted from their analyses, as well as the deliberately manipulated data such as that produced by the Climate Research Unit of the University of East Anglia in the UK.

The following are very small samples of the figures and tables in my report. Table 1 is the comprehensive and extensive database used in the analyses. It is available in computer-readable format.

Table 1.  Database used in the analyses
Set Process Stations Years
1 Water surface evaporation 20 1180
2 Concurrent rainfall 20 1180
3 District rainfall 93 7141
4 Dam inflow 14 825
5 River flow 14 1052
6 Flood peak maxima 17 1235
7 Groundwater 4 312
8 Southern oscillation index 1 114
  TOTAL 183 11 804

Figure 9 is very important. It demonstrates the unequivocal synchronous relationship between annual sunspot numbers and the annual flows in the Vaal River that is South Africa’s major river. Note the alternating above (rising) and below (falling) flow sequences. Note also their synchronous relationship with sunspot numbers; as well as the statistically significant (95%), 21-year periodicity in the flow data that is synchronous with the double sunspot cycle.

Notice also the absence of 11-year periodicity in the correlogram of the Vaal River. It is no wonder that climate change scientists have been unable to detect synchronous relationships with the 11-year sunspot cycle. It does not exist! This is because the properties of the alternating solar cycles are fundamentally different to the extent that the climatic responses are also very different.
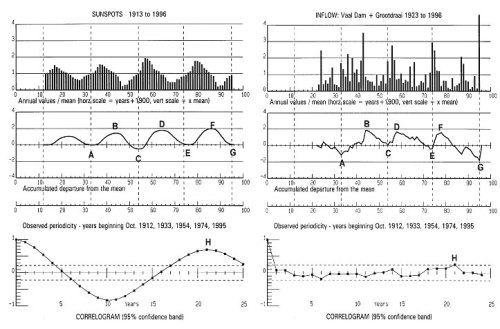
Figure 9. Comparisons of the characteristics of annual sunspot numbers with corresponding characteristics of the annual flows in the Vaal River.

Another frequent error associated with the sunspot cycle is the assumption that the maximum effect is associated with the sunspot maxima. This is altogether wrong. The maxima occur immediately after the solar minima. Table 10 illustrates this.

Table 10. Comparison of sudden changes in the annual flows in the Vaal River with corresponding sudden changes in sunspot numbers
Three-year totals of flows in Vaal River (% of record mean) Three-year totals associated with the corresponding sunspot minimum
Minimum year Three previous years Three subsequent years Sunspot minimum Three lowest years Three subsequent years
1932/33 100 388 1933 25 250
1941/42 297 625 1944 56 277
1953/54 205 538 1954 50 370
1965/66 234 241 1964 53 247
1972/73 177 654 1975 73 275
1986/87 112 438 1986 60 400
1994/95 135 464+ 1996 48 277
Average 180 478 Average 52 300


Table 12 demonstrates the well-known Joseph Effect of alternating above and below average multi-year sequences published separately by two other South African authors. It is very interesting. Compare the durations of the wet and dry sequences with Josephs biblical prophecy of seven years of plenty followed by seven years of famine. The coincidence is not fortuitous.

Table 12. Wet and dry sequences
Years Wet/dry Length of sequence Sunspot cycles
    Wet Dry  
Bredenkamp:   Mzimgazi + St Lucia + Uitenhage + Wondergat
1919-24 Wet 5   1913-22
1925-29 Dry   4 1923-32
1930-39 Wet 9   1933-43
1941-53 Dry   12 1944-53
1955-62 Wet 7   1954-63
1965-71 Dry   6 1964-75
1972-78 Wet 6   1976-85
1980-83 Dry   3 -do-
1984-90 Wet 6    
Tyson: South African rainfall
1905-15 Dry   10 1901-12
1916-24 Wet 8   1913-22
1925-32 Dry   7 1923-32
1933-43 Wet 10   1933-43
1944-52 Dry   8 1944-53
1953-61 Wet 8   1954-63
1962-70 Dry   8 1964-75
1971-80 Wet 9   1976-85

This table completely destroys the repeatedly stated claim in the IPCC literature that there is no meaningful linkage between variations in solar activity and synchronous linkages with variations in the climatic processes.

Conclusions

The following conclusions were summarised on the first page of my report.

Continued global warming will NOT

  • Pose a threat to water supplies
    • Adversely affect agricultural production
  • Increase the risk of floods and droughts
  • Increase the spread of malaria
  • Increase the eutrophication of water in dams
  • Increase soil erosion
  • Result in the loss of natural plant and animal species
  • Result in desertification

There is no believable evidence to support these claims.

It would be most unwise

For South African authorities to force the implementation of costly measures, based on unverifiable global climate models, and abstract theory, for which there is no believable evidence.

References

My technical report contained 50 references. The following are seven references to my prior publications in scientific journals. They were therefore available to the Stern Review.

Alexander W J R 1985. Hydrology of low latitude southern hemisphere landmasses. In Hydrobiologia, ed Davies & Walmsley, Junk Publishers, Holland.

Alexander W J R 1995. Floods, droughts and climate change. South African Journal of Science 91, 403-408.

Alexander W J R 1999. Risk and society – an African perspective. United Nations commissioned study. Geneva, Switzerland.

Alexander W J R 2002a. Climate change – the missing links. Science in Africa. September 2002.

Alexander W J R 2002b. Statistical analysis of extreme floods. Journal of the South African Institution of Civil Engineering, 44 (1) 2002 20-25.

Alexander W J R (2005a). Development of a multi-year climate prediction model. Water SA Vol 31 No 2 April 2005.

Alexander W J R (2005b) Linkages between Solar Activity and Climatic Responses. Energy & Environment, Volume 16, No 2, 2005.

Finally

Why was my report deliberately ignored by the Stern Review despite my protests and offers to come to the UK to present it to a critical audience of his choice? There can only be one answer. It completely undermines the claim is of exclusive human causality of climate change. Now the whole climate change issue is in total disarray as a consequence of this demonstrably false assumption.

Many scientists in other fields have reported similar experiences. It is now very clear that the manipulation of science in the IPCC publications was a general practice. There are increasing suspicions that these manipulations were intended to force developing nations to undertake costly measures that would reduce their rising economic competitiveness with the West. The failure of the World Trade Organisation to produce a binding international agreement is also a consequence of Western nations protecting their own interests.

The situation is very fluid. China has already overtaken the Western nations as Africa’s major trading partner. This is one battle that the West cannot win.

I’m prepared to e-mail a copy of my technical report and the data used in the analyses in computer readable format, with my compliments to anybody who has an interest.

W.J.R. Alexander Pr Eng

Professor Emeritus, Department of Civil Engineering, University of Pretoria, South Africa.

Fellow, South African Institution of Civil Engineering

Member, United Nations Scientific and Technical Committee on Natural Disasters, 1994 – 2000

Email alexwjr@iafrica.com

Comments Off on Climate Change: The West vs The Rest by Will Alexander

Filed under Guest Weblogs

Interesting Comment On Climate Modeling By James Lovelock

There is an interesting interview of James Lovelock by Leo Hickman titled

James Lovelock on the value of sceptics and why Copenhagen was doomed [h/t/ to eric144 who posted a comment #3) in the post  Picking Cherries and Hot Fudge].

The header for this section of the interview is titled “On the over-reliance on computer modelling” and reads 

I remember when the Americans sent up a satellite to measure ozone and it started saying that a hole was developing over the South Pole. But the damn fool scientists were so mad on the models that they said the satellite must have a fault. We tend to now get carried away by our giant computer models. But they’re not complete models. They’re based more or less entirely on geophysics. They don’t take into account the climate of the oceans to any great extent, or the responses of the living stuff on the planet. So I don’t see how they can accurately predict the climate. It’s not the computational power that we lack today, but the ability to take what we know and convert it into a form the computers will understand. I think we’ve got too high an opinion of ourselves. We’re not that bright an animal. We stumble along very nicely and it’s amazing what we do sometimes, but we tend to be too hubristic to notice the limitations. If you make a model, after a while you get suckered into it. You begin to forget that it’s a model and think of it as the real world. You really start to believe it.

I have discussed climate models in several posts; e.g. see

What Are Climate Models? What Do They Do?

Q & A How Skillful Are The Global Climate Models Given The Relatively Small Radiative Human-Caused Forcing?

I agree with James Lovelock on his view of models. As I wrote in my first post listed above

“…. the IPCC and US National Assessments appropriately should be communicated as process studies in the context that they are sensitivity studies. It is a very convoluted argument to state that a projection is not a prediction. The specification to periods of time in the future (e.g., 2050-2059) and the communication in this format is very misleading to the users of this information. This is a very important distinction which has been missed by impact scientists who study climate impacts using the output from these models and by policymakers.”

Until climate modellers accept the limitations of their models, they will continue to improperly present model results to policymakers. The result will a perpetuation of the perspective presented in the excellent  Der Speigel article How the Science of Global Warming was Compromised.

Comments Off on Interesting Comment On Climate Modeling By James Lovelock

Filed under Climate Models, Climate Science Op-Eds