Category Archives: Climate Change Metrics

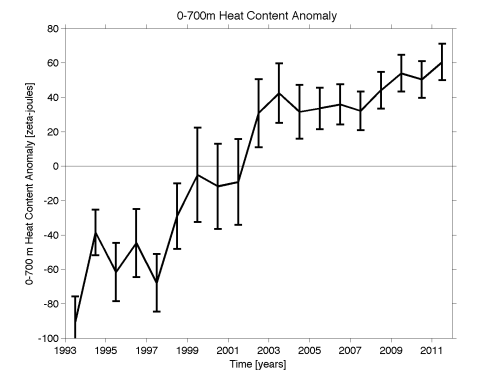
Publication Of “Reply to “Comment On ‘Ocean Heat Content And Earth’s Radiation Imbalance. II. Relation To Climate Shifts’ ” by Nuccitelli Et Al. By Douglass and Knox 2012

David Douglass alerted me to his reply to

Dana Nuccitelli, Robert Way, Rob Painting, John Church, John Cook: 2012: Comment on “Ocean heat content and Earth’s radiation imbalance. II. Relation to climate shifts” . Physics Letters A

in

D.H. Douglass, R.S. Knox, 2012: Reply to “Comment on ‘Ocean heat content and Earth’s radiation imbalance. II. Relation to climate shifts’ ” by Nuccitelli et al. Physics Letters A

The first and last paragraphs of his Reply summarize with

Nuccitelli, Way, Painting, Church and Cook [1] comment on our Letter “Ocean heat content and Earth’s radiation imbalance. II. Relation to climate shifts” [2]. Their criticism is unwarranted on at least three essential grounds. (1) It is based on a misunderstanding of the climate shift concept, which is central to our Letter; (2) in making its claim of incompleteness because of neglect of the deeper ocean heat content, it ignores our statement of possible error and introduces incompatible data; (3) it over-interprets our comments about CO2 forcing. We expand on these points.

In sum, we show that the criticism of our results (change of slope in the implied FTOA at the climate shift of 2001–2002) by Nuccitelli et al. is unwarranted because they used different data of less temporal resolution. A more careful analysis of this data shows, in fact, consistency and not conflict with our results.

I recommend reading the Douglass and Knox original article, and both the Comment and Reply. The original article is

D.H. Douglass, R.S. Knox, 2012: Ocean heat content and Earthʼs radiation imbalance. II. Relation to climate shifts. Physics Letters A, Volume 376, Issue 14, 5 March 2012, Pages 1226-1229

source of image

Comments Off on Publication Of “Reply to “Comment On ‘Ocean Heat Content And Earth’s Radiation Imbalance. II. Relation To Climate Shifts’ ” by Nuccitelli Et Al. By Douglass and Knox 2012

Filed under Climate Change Metrics, Research Papers

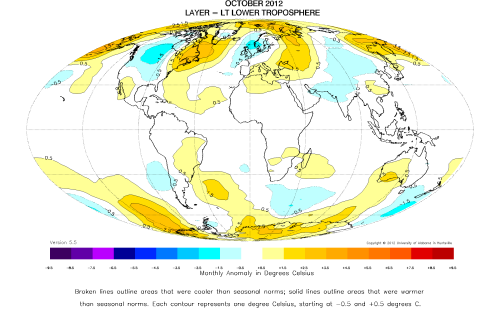
University Of Alabama At Huntsville October 2012 Lower Tropospheric Temperature Analysis

Phillip Gentry has provided us with the University of Alabama at Huntsville global lower  tropospheric temperature analysis. Their figures are posted at the top of this post, and their text below [click on the figures for a clearer version]

Global Temperature Report: October 2012

Global climate trend since Nov. 16, 1978: +0.14 C per decade

October temperatures (preliminary)

Global composite temp.: +0.33 C (about 0.59 degrees Fahrenheit) above 30-year average for October.

Northern Hemisphere: +0.30 C (about 0.54 degrees Fahrenheit) above 30-year average for October.

Southern Hemisphere: +0.36 C (about 0.65 degrees Fahrenheit) above 30-year average for October.

Tropics: +0.11 C (about 0.20 degrees Fahrenheit) above 30-year average for October.

September temperatures (revised):

Global Composite: +0.34 C above 30-year average

Northern Hemisphere: +0.35 C above 30-year average

Southern Hemisphere: +0.33 C above 30-year average

Tropics: +0.15 C above 30-year average

(All temperature anomalies are based on a 30-year average (1981-2010) for the month reported.)

Notes on data released Nov. 6, 2012:

The pause in the anticipated El Niño Pacific Ocean warming event — seen in the sea surface temperatures in the Pacific during the past two months — is now appearing in the tropical upper air, according to Dr. John Christy, a professor of atmospheric science and director of the Earth System Science Center at The University of Alabama in Huntsville. The absent El Niño shows up in the relative temperatures of the world’s parts: While October 2012 was the second warmest October in the satellite record for the Southern Hemisphere and fourth warmest for the north, the tropics were scarcely warmer than normal for the month — only the 13th “warmest” October in the 34-year satellite record.

Compared to seasonal norms, the coldest area on the globe in October was south central Saskatchewan to the east of Saskatoon, which was 2.28 C (about 4.1 Fahrenheit) cooler than normal for the month. The warmest area was in the central Bering Sea, where temperatures averaged 3.95 C (about 7.1 degrees Fahrenheit) warmer than seasonal norms for October.

Archived color maps of local temperature anomalies are available on-line at:

http://nsstc.uah.edu/climate/

The processed temperature data is available on-line at:

vortex.nsstc.uah.edu/data/msu/t2lt/uahncdc.lt

As part of an ongoing joint project between UAHuntsville, NOAA and NASA, John Christy, a professor of atmospheric science and director of the Earth System Science Center (ESSC) at The University of Alabama in Huntsville, and Dr. Roy Spencer, an ESSC principal scientist, use data gathered by advanced microwave sounding units on NOAA and NASA satellites to get accurate temperature readings for almost all regions of the Earth. This includes remote desert, ocean and rain forest areas where reliable climate data are not otherwise available.

The satellite-based instruments measure the temperature of the atmosphere from the surface up to an altitude of about eight kilometers above sea level. Once the monthly temperature data is collected and processed, it is placed in a “public” computer file for immediate access by atmospheric scientists in the U.S. and abroad.

Neither Christy nor Spencer receives any research support or funding from oil, coal or industrial companies or organizations, or from any private or special interest groups. All of their climate research funding comes from federal and state grants or contracts.

Comments Off on University Of Alabama At Huntsville October 2012 Lower Tropospheric Temperature Analysis

Filed under Climate Change Metrics

“Hurricanes: Their Nature And Impacts On Society” Published In 1997 By Pielke Jr. and Pielke Sr. Available As A PDF

Our book

Pielke, R.A., Jr. and R.A. Pielke, Sr., 1997: Hurricanes: Their nature and impacts  on society. John Wiley and Sons, England, 279 pp.

is available as a pdf. The material is not updated for more recent storms (since 1997) but the recommendations and information on tropical cyclones may useful in the discussion of the impacts of Sandy. Of particular interest related to such late season hurricanes is the text on Hurricane Hazel (1954) where we wrote that

Hazel joined with another storm system to devastate inland communities from Virginia to Ontario, Canada. Washington, DC experienced its strongest winds ever recorded……..In 1954, Hurricane Hazel…..underwent a similar rapid acceleration to a speed of 60 mph (27 meters per second), as strong south to southwesterly winds developed to the west of the storm. Hazel crossed the North Carolina coastline at 9:25 am on 15 October, and reached Toronto, Canada only 14 hours later where it resulted in 80 deaths (Joe et al. 1995). At that time, it was the most destructive hurricane to reach the North Carolina coast. Every fishing pier was destroyed over a distance of 170 miles (270 km) from Myrtle Beach, South Carolina to Cedar Island, North Carolina. All traces of civilization were practically annihilated at the immediate waterfront between Cape Fear and the South Carolina state line.

We reported that

“….tropical cyclones can become absorbed into developing mid-latitude storms thereby infusing added moisture and wind energy from the tropical cyclone and resulting in a more intense mid-latitude storm than otherwise would occur.

Clearly, this later behavior is what made Sandy a much stronger storm than either a mid-latitude or hurricane would have been separately. In contrast to Hazel, however, Sandy was not as strong a hurricane. It also tracked towards the west as it interacted with the developing mid-latitude storm rather than accelerating northward as Hazel did.  This resulted in the large fetch of easterly and southeasterly winds into northern New Jersey, Long Island and New Your City which produced the large storm surge.

Our book also discusses the impacts of tropical cyclones which includes extreme winds, storm surge, tornadoes, flash flooding and riverine (i.e. large river) flooding. The analysis has yet to be completed, but I suspect that storm surge will attributed, by far, to  largest economic damage.

Also, with a storm of this magnitude, the National Hurricane Center, the National Center for Environmental Prediction, the media and public officials must be recognized and commended for their early warming. This has resulted in a much lower loss of life than would have otherwise occurred.

Comments Off on “Hurricanes: Their Nature And Impacts On Society” Published In 1997 By Pielke Jr. and Pielke Sr. Available As A PDF

Filed under Books, Climate Change Metrics

Further Analysis Of The Size Of Tropical Storm and Hurricane Force Winds in Sandy

The above outstanding analysis of the wind field of Hurricane Sandy by NOAA’s AOML Hurricane Research Division [h/t Frank Marks] further documents the size of tropical storm and hurricane force winds. As noted in their caption, these winds are valid for marine exposure over water and open terrain exposure over land. Other time periods and analyses can be viewed at their website – Sandy Wind Analysis.

Comments Off on Further Analysis Of The Size Of Tropical Storm and Hurricane Force Winds in Sandy

Filed under Climate Change Metrics

The Size Of Hurricane Sandy – How Does It Compare?

Hurricane Sandy became  a very large tropical cyclone as it morphed into a hybrid large low pressure system. The figure above from our book

Pielke, R.A., Jr. and R.A. Pielke, Sr., 1997: Hurricanes: Their nature and impacts  on society. John Wiley and Sons, England, 279 pp. Hurricane Sandy provides examples of sizes of tropical cyclones that occurred in the past. The largest, Tip in 1979, was from the western North Pacific Ocean.

The size of Sandy, as reported by the National hurricane Center, is given for two time periods late in its lifetime below.

1100 AM EDT SUN OCT 28 2012

MAXIMUM SUSTAINED WINDS…75 MPH…120 KM/H
PRESENT MOVEMENT…NE OR 45 DEGREES AT 14 MPH…22 KM/H
MINIMUM CENTRAL PRESSURE…951 MB…28.08 INCHES

HURRICANE-FORCE WINDS EXTEND OUTWARD UP TO 175 MILES…280 KM…FROM
THE CENTER…AND TROPICAL-STORM-FORCE WINDS EXTEND OUTWARD UP TO 520
MILES…835 KM.

1100 AM EDT MON OCT 29 2012

MAXIMUM SUSTAINED WINDS…90 MPH…150 KM/H
PRESENT MOVEMENT…NNW OR 330 DEGREES AT 18 MPH…30 KM/H
MINIMUM CENTRAL PRESSURE…943 MB…27.85 INCHES

HURRICANE-FORCE WINDS EXTEND OUTWARD UP TO 175 MILES…280 KM…
MAINLY SOUTHWEST OF THE CENTER…AND TROPICAL-STORM-FORCE WINDS
EXTEND OUTWARD UP TO 485 MILES…780 KM.

For comparison with the figure from the book, the distance between 5 degrees of latitude in the figure below is 555 km (300 nautical miles or 345 statute miles ).  Tip had tropical storm winds out to ~700km on the east side and  hurricane winds out to about ~175 km from the eye.

The  analyses from NHC [shown below] show that Sandy’s size of tropical storm and hurricane winds were comparable to Tip, but, fortunately, the hurricane winds were much less in Sandy.  Also, the radius of hurricane winds, appears to have contracted substantially at and right after landfall.

Clearly, Sandy was a giant tropical cyclone, and rivals the largest ones in size that occur in the Pacific Ocean. A major difference with Tip, however, is that Tip attained wind speeds of up to 190 mph (305 km/h) and a central pressure of 870 millibars (25.69 inches of mercury) – see, while Sandy was a much more modest hurricane.  This suggests the potential that if a major hurricane (such as Hazel from 1955) followed the same path as Sandy as it merged with a midlatitude storm system, a truly worse-case superstorm could occur.  Thus the worse-case scenario, even with the current climate, did not happen with Sandy.

Regardless, how, or if, the risk from hurricane landfalls of this type increases in the future, a prudent policy path would be to reduce the risk from all plausible hurricane landfalls. through more effective land use planning. 

Comments Off on The Size Of Hurricane Sandy – How Does It Compare?

Filed under Climate Change Metrics

September 2012 Lower Tropospheric Temperature Anomaly Analysis From The University of Alabama At Huntsville

Phillip Gentry has provided us with the September 2012 lower tropospheric temperature anomaly analysis from the University of Alabama at Huntsville. It is presented below [click each image for a clearer view]. Note the large spatial variations in the temperature anomalies.

Global Temperature Report: August 2012

Changing satellites as instruments die

Global climate trend since Nov. 16, 1978: +0.14 C per decade

September temperatures (preliminary)

Global composite temp.: +0.34 C (about 0.61 degrees Fahrenheit) above 30-year average for September.

Northern Hemisphere: +0.35 C (about 0.63 degrees Fahrenheit) above 30-year average for September.

Southern Hemisphere: +0.33 C (about 0.59 degrees Fahrenheit) above 30-year average for September.

Tropics: +0.15 C (about 0.22 degrees Fahrenheit) above 30-year average for September.

August temperatures (revised):

Global Composite: +0.21 C above 30-year average

Northern Hemisphere: +0.21 C above 30-year average

Southern Hemisphere: +0.20 C above 30-year average

Tropics: +0.06 C above 30-year average

(All temperature anomalies are based on a 30-year average (1981-2010) for the month reported.)

Notes on data released Oct. 8, 2012:

September 2012 was the third warmest September in the 34-year satellite temperature record, according to Dr. John Christy, a professor of atmospheric science and director of the Earth System Science Center at The University of Alabama in Huntsville. Three of the last four Septembers were warmer than September 1998, during the El Niño Pacific Ocean warming event “of the century.” The last September that was cooler than the 30-year baseline seasonal norm was in 2000.

Compared to seasonal norms, the coldest spot on the globe in September was (again) at the South Pole, where the Antarctic spring temperature averaged 3.31 C (almost 6 degrees Fahrenheit) colder than normal. The “warmest” spot was just north of Monbetsu, Japan, where temperatures in September averaged 3.72 C (about 6.7 degrees Fahrenheit) warmer than seasonal norms.

The temperatures reported in this report are from different instruments than have been used in the recent past, Christy said.

“Some things are just out of our control,” he said. “In the past three years our backbone satellite – NASA’s AQUA, which has been operating since 2002 – has experienced an increase in ‘noise.’ Until now, however, the differences between temperature values recorded by AQUA and two other satellites, NOAA 15 and NOAA 18, were within 0.1 C. That is within our typical margin of error for monthly global values and not of much concern.

“In September, the difference jumped to 0.2 C. Looking at the daily values, that gap was increasing as the month ended. It appears that for our climate project, AQUA is no longer useful.”

AQUA has on-board propulsion that allows it to maintain a stable orbit, which means the temperature data it collected was also stable. Orbital drift (east or west) and orbital decay cause systemic changes in temperature data, either warmer or cooler depending on which way the satellite’s orbit is shifting. While the UAHuntsville team has developed and published techniques for correcting errors caused by orbital drift or decay, data from a satellite in a stable orbit is easier to process and should be more reliable.

There is, however, no technique to correct for a failing instrument.

“We haven’t used NOAA-15 or NOAA-18 in the past few years because they each are drifting in orbit,” Christy said. “NOAA-15 is moving to slightly warmer temperature and NOAA-18 to slightly cooler. It is clear, however, that the slight differences between the temperature values they report (less than 0.1 C) are small and their average will be very close to the actual temperatures, as their errors will cancel each other out.

“We have implemented a simple solution for the data problem, which we will call version 5.5 of the UAHuntsville satellite dataset,” Christy said. “For the data beginning in January 2010 we will use the average of NOAA-15 and NOAA-18, and will leave out AQUA. The only change is the source of data. As it turns out, the long-term global climate trend doesn’t change, because the real problem only developed in the past month.”

The UAHuntsville team is working now on version 6.0 of the dataset, which will more precisely account for issues like the small orbital drifts in NOAA-15 and NOAA-18. There is no schedule for the release of the new dataset: “We are taking our time and having an independent scientist write the new code from scratch, to insure that it is testable and transportable. That takes time. Until the new version is released, the values provided by version 5.5 will give us more accurate information than relying on the instrument on the AQUA satellite.”

Archived color maps of local temperature anomalies are available on-line at:

http://nsstc.uah.edu/climate/

The processed temperature data is available on-line at:

vortex.nsstc.uah.edu/data/msu/t2lt/uahncdc.lt

As part of an ongoing joint project between UAHuntsville, NOAA and NASA, John Christy, a professor of atmospheric science and director of the Earth System Science Center (ESSC) at The University of Alabama in Huntsville, and Dr. Roy Spencer, an ESSC principal scientist, use data gathered by advanced microwave sounding units on NOAA and NASA satellites to get accurate temperature readings for almost all regions of the Earth. This includes remote desert, ocean and rain forest areas where reliable climate data are not otherwise available.

The satellite-based instruments measure the temperature of the atmosphere from the surface up to an altitude of about eight kilometers above sea level. Once the monthly temperature data is collected and processed, it is placed in a “public” computer file for immediate access by atmospheric scientists in the U.S. and abroad.

Neither Christy nor Spencer receives any research support or funding from oil, coal or industrial companies or organizations, or from any private or special interest groups. All of their climate research funding comes from federal and state grants or contracts.

Comments Off on September 2012 Lower Tropospheric Temperature Anomaly Analysis From The University of Alabama At Huntsville

Filed under Climate Change Metrics, Climate Science Reporting

New Paper “An Empirical Study Of The Impact Of Human Activity On Long-Term Temperature Change In China: A Perspective From Energy Consumption” By Li And Zhao 2012

Figure from Li and Zhao (2012) –  Spatial distribution of high, mid and low energy consumption region in China. Data for Tibet and Taiwan are absent. Green spot is the provincial capital cities of China.

Jos de Laat has alerted us to a new paper. It is

Li, Y. and X. Zhao (2012), An empirical study of the impact of human activity on long-term temperature change in China: A perspective from energy consumption, J. Geophys. Res., 117, D17117, doi:10.1029/2012JD018132.

The abstract reads [highlight added]

Human activity is an important contributor to local temperature change, especially in urban areas. Energy consumption is treated here as an index of the intensity of human induced local thermal forcing. The relationship between energy consumption and temperature change is analyzed in China by Observation Minus Reanalysis (OMR) method. Temperature trends for observation, reanalysis and OMR are estimated from meteorological records and 2 m-temperature from NCEP/NCAR Reanalysis 1 for the period 1979–2007. A spatial mapping scheme based on the spatial and temporal relationship between energy consumption and Gross Domestic Production (GDP) is developed to derive the spatial distribution of energy consumption of China in 2003. A positive relationship between energy consumption and OMR trends is found in high and mid energy consumption region. OMR trends decline with the decreasing intensity of human activity from 0.20°C/decade in high energy consumption region to 0.13°C/decade in mid energy consumption region. Forty-four stations in high energy consumption region that are exposed to the largest human impact are selected to investigate the impact of energy consumption spatial pattern on temperature change. Results show human impact on temperature trends is highly dependent on spatial pattern of energy consumption. OMR trends decline from energy consumption center to surrounding areas (0.26 to 0.04°C/decade) and get strengthened as the spatial extent of high energy consumption area expands (0.14 to 0.25°C/decade).

Excerpts from this paper include

Besides the impact of land use change on climate, the thermal impact induced by human activity within city plays significant role and should not be ignored. One of them is the anthropogenic heat released from energy consumption. Several studies have shown that anthropogenic heat is important to the development of UHI. Simulation results from a case study in Philadelphia suggested that anthropogenic heat contributes about 2~3C to the nighttime heat island in winter [Fan and Sailor, 2005].

The conclusion contains the text

Our results show significant warming has occurred for most stations in China and the magnitude of warming is closely related to energy consumption, which represents the intensity of human activity. For high and mid energy consumption group, OMR trends decline with the decrease of energy consumption. OMR trends for high and mid energy consumption group is 0.20 and 0.13C/decade respectively. Stronger warming is observed for station with high energy consumption, which usually locates in or near cities. Therefore, the strong warming is more likely a consequence of the local thermal forcing induced by human activity.

It seems that stations belong to high and mid energy consumption group in this study are affected
by human impact to a discernible extent. Just as De Laat[2008] demonstrated, anthropogenic heat released from energy consumption may very well have contributed to the observed temperature change patterns.Thus, it may raise more attention to consider the influence of human activity on surface temperature records in the past and next decades.

This study provides even more motivation for Anthony Watts to expand his station siting quality project to the entire globe!

Comments Off on New Paper “An Empirical Study Of The Impact Of Human Activity On Long-Term Temperature Change In China: A Perspective From Energy Consumption” By Li And Zhao 2012

Filed under Climate Change Metrics, Research Papers

Arctic Lower Tropospheric Temperature Trends Since 1979

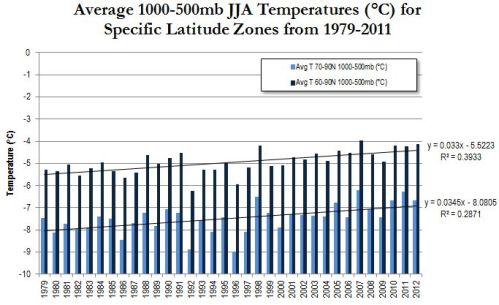
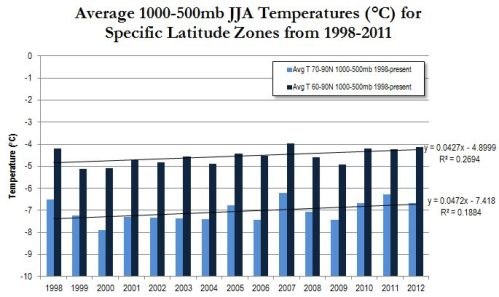
As part of a set of papers we are working on, Emily Gill of the University of Colorado has analyzed the NCEP/NCAR lower tropospheric temperature trends from latitude 60N and 70N to the North Pole for June,July and August. This is shown below for two time periods; the top figure from the time period when satellite coverage becames global and the bottom figure since the large ENSO event in 1998.

These plots are provided as part of the examination of the reasons for the greater sea ice melt in recent years, which I discussed in the post

Summary Of Arctic Ice Decline – Recommendations For Investigation Of The Cause(s)

These two figures address the issue raised in that post to perform

 “…analyses of lower tropospheric and surface temperature anomalies by season for the Arctic sea ice regions.”

It is clear there has been warming over the period of record. However, it is relatively small.  Using a linear regression, the June, July and August warming since 1979 was +1.0 C, and since 1998 +0.5 to +0.6 C in the region from 60N and from 70N North Pole. There is quite bit of interannual variability such that a linear trend does not explain a majority of the variations over this time period.

Emily Gill has also provided the global June, July and August analyses. The global linear regression change for 1979 to 2012 is +0.73C.  For the period 1998 to 2012 and for 1999 to 2012 the linear regression change is +0.43 C and +0.57 C, respectively (the different start years were to include the 1998 large positive value associated with the large ENSO event).  Interestingly, there is not much of an Arctic amplification of warming.

It is not clear how this modest lower tropospheric warming would have resulted in such large Arctic sea ice melting unless

i) the warmth was accompanied by less cloudiness than average,

and

ii) the sea ice was always very marginally close to melting.

Comments Off on Arctic Lower Tropospheric Temperature Trends Since 1979

Filed under Climate Change Metrics, Uncategorized

Were 2009 and 2010 The Warmest Years In India Since 1901? By S. Raghavan

UPDATE OCT 13 2012: The article discussed below is available from here – INDIAN METEOROLOGICAL SOCIETY CHENNAI CHAPTER.

S. Raghavan of  the Indian Meteorological Society, Chennai in India has sent us the article below which appeared in the publication Breeze Volume 14 in June 2012. S. Raghavan is a retired Deputy Director-General of Meteorology of the India Meteorological Department. His earlier post on my weblog is

A Perspective on Weather and Climate Science by S. Raghavan

Were 2009 and 2010 the warmest years in India since 1901? by S. Raghavan

1. Warmest years

The India Meteorological Department (IMD) announced in 2010 that 2009 was the warmest year in India since 1901 (Attri and Tyagi, 2010). Again in 2011 it was stated that 2010 was the warmest since 1901 (IMD, 2011). The annual mean temperature for the country as a whole is estimated to have risen by 0.56ºC over the period. This agrees with the widespread perception that the world is warming.

What was the basis for this assessment? The IMD has utilised the records of about 210 surface observatories (including those at major cities) all over India and computed the average of the daily maximum and minimum temperatures at each station. Data have been gridded and weighted average of all grid values has been calculated for the country as a whole. While this is a straightforward process there are certain limitations of the data which need to be considered, as the likely errors in the data could be larger than the “expected” warming due to any climate change.

2. Changes in Land Use

Over the period of more than a century many land use changes have evidently taken place all over the country. The changes in urban areas may be in the form of new structures which can contribute radiation or alter wind circulation. In other areas there can be changes such as development of irrigated lands, change in farming practices, drying up or filling up of water bodies and removal of vegetation. These changes affect the radiation
balance, evaporation, soil moisture and wind flow. The observed increase in temperature can have a component due to land use change and a component due to changes in atmospheric composition and it will be difficult to separate the two.

It is interesting to note that the Inter-Governmental Panel on Climate Change (IPCC) (IPCC, 2012) has recently redefined climate change as

“A change in the state of the climate that can be identified (e.g., by using statistical tests) by changes in the mean and/or the variability of its properties and that persists for an extended period, typically decades or longer. Climate change may be due to natural internal processes or external forcings, or to persistent anthropogenic changes in the composition of the atmosphere or in land use”.

This is different from the previous definition. IPCC states

“This definition differs from that in the United Nations Framework Convention on Climate Change (UNFCCC), where climate change is defined as: “a change of climate which is attributed directly or indirectly to human activity that alters the composition of the global atmosphere and which is in addition to natural climate variability.”

The IMD (Attri and Tyagi, 2010) is therefore correct in listing the trend under “Climate Change Scenario”. However the land use changes in each area and their impact will depend on many factors (meteorological as well as socio-economic) and will be widely different in different areas. Hence the temperature changes may not be compatible among all the stations or the particular station’s own data of earlier decades. An average of the temperatures for the whole country is therefore unlikely to be a good measure of climate change.

3. Deterioration of Exposure Conditions

In case an observatory site is changed, IMD has procedures to compare observations at the new and old sites for ensuring compatibility. But the change in exposure conditions at the same site is difficult to quantify or correct for. In major cities such as Mumbai and Kolkata where the observatories are surrounded by newly developed
roads and buildings, the changes are large and the observatory exposure is drastically affected. In addition to the changes in radiation fluxes and wind flow, even the instruments could have been shadowed in some cases.
It is not often possible to shift the observatory to a more open and representative site to overcome this problem. As different stations are differently affected, the computed country average will be affected.

4. Heat island effect

The heat island effect in cities is well-known. A study organised by the present author at Chennai (Jayanthi , 1991) in the 1980s showed heat island effects of up to 4ºC in some pockets in the minimum temperature epoch in winter. The effect on maximum temperature may be expected to be smaller. The result indicates that the heat island effect
is much larger than any increase which may be expected due to climate change. There may also be effects of changes in local wind circulations due to urban development or due to increasing air pollution. Such an effect will bias the country average.

5. Maximum and minimum temperatures

Maximum and minimum temperatures may be affected differently by land use changes or the heat island effect. Hence an average of the maximum and minimum temperatures may not bring out the correct change over time if any.

6. Network Selection

The basis of selection of the 210 stations for the computation of trend is not clear. Presumably the departmentally manned observatories with long period records which can be expected to have been set up originally with good exposure and yield more reliable data have been selected. Presumably there has been no change in type of instrumentation or observing practices at these stations. These need to be verified.

The USA has a Historical Climate Network consisting of a subset of stations of the National Weather Service for Climate change analysis. But even this is said to have several stations with unsatisfactory exposures (Davey and Pielke, 2005). More recently a U.S. Climate Reference Network (CRN) has been established (Vose et al., 2005). The
IMD also maintains a network of 10 Global Atmosphere Watch stations (GAW, formerly Background Air Pollution Monitoring Network or BAPMoN) as per WMO protocols and standards (Attri and Tyagi 2010). These may perhaps have a record which has not been significantly affected by the above effects but these stations are available only from 1974. They are few in number and widely different in geographical distribution and in topographic characteristics. Hence they may also not be representative of the country. The optimum station density network for assessing trends may need to be determined (See e.g. Voss and Menne, 2004).

7. Correction of data

Evidently while assessing long-term trends the impact of these effects has to be minimised. How is this to be done?

The stations to be included in the analysis can be reviewed to exclude those which are affected by significant heat island effect or exposure deterioration. A station by station check is necessary to exclude those which have poor or non-standard exposures or are unrepresentative in other respects. Techniques for “homogeneity adjustments” have
been suggested (e.g. Easterling et al., 1996). Another method suggested is to use temperature anomalies instead of the temperatures themselves because temperature anomalies are expected to be much more geographically coherent than actual temperatures (Peterson, 2006).The anomaly time series is derived by subtracting the mean
temperature from a base period. Such corrections need to be effected before announcing to the public the rise in the temperatures.

8. Significance and interpretation of temperature trends

How to interpret the trends corrected as suggested and use the information?

There is a widespread view among scientists that near-surface temperature is not the most reliable metric to assess climate change. Other parameters such as ocean heat content have been suggested as most of the energy received by the earth is stored in the oceans (e.g. Ellis et al. 1978). Publishing a temperature trend without interpreting it may cause the public to derive wrong conclusions. For example the public and the media often state and feel during every summer that the current summer is hotter than any they experienced earlier. They interpret this as climate change. This perception is in most cases not correct.

As discussed earlier, whether the observed trend is due to land use change or change in atmospheric composition, it is to be considered as climate change. But the actions to be taken to minimise the trend will be different in the two cases. The meteorological community should be able to advise decision-makers about measures to be taken in the two cases. Any information which goes to users should put these issues in proper perspective.

References

Attri S. D. and A Tyagi, 2010, “Climate Profile of India” by Met Monograph No. Environment Meteorology-01/2010

Davey, C. A., and R. A. Pielke Sr., 2005: Microclimate exposures of surface-based weather stations. Bull. Amer. Meteor. Soc., 86, 497–504.

Easterling, D. R., T. C. Peterson, and T. R. Karl, 1996, On the development and use of homogenized climatological datasets. J. Climate, 9, 1429–1434.

Ellis J. S., T. H. Vonder Haar, S. Levltus and A. H. Oort, 1978, The Annual Variation in the Global Heat Balance of the Earth, J. Geophys. Res., 83, 1958-1962IMD. 2011, Press Release dated 13 January 2011

IPCC, 2012: Summary for Policymakers. In: “Managing the Risks of Extreme Events and Disasters to Advance Climate Change Adaptation” [Field, C.B., V. Barros, T.F. Stocker, D. Qin, D.J. Dokken, K.L. Ebi, M.D. Mastrandrea, K.J. Mach, G.-K. Plattner, S.K. Allen, M. Tignor, and P.M. Midgley (eds.)]. A Special Report of Working Groups I and II of the Intergovernmental Panel on Climate Change. Cambridge University Press, Cambridge, UK, and New York, NY, USA, pp. 1-19. (available on IPCC website).

Jayanthi N., 1991, Heat Island study over Madras city and neighbourhood, Mausam, 42, 1, 83-88.

Vose R.S,, D. R. Easterling, T. R. Karl and M. Helfert, 2005, “Comments on “Microclimate Exposures of Surface-Based Weather Stations”, Bull. Amer. Meteor. Soc., 86, 504-506.

Vose, R. S., and M. J. Menne, 2004: A method to determine station density requirements for climate observing networks. J. Climate, 17, 2961–2971.

source of image

Comments Off on Were 2009 and 2010 The Warmest Years In India Since 1901? By S. Raghavan

Filed under Climate Change Metrics, Climate Science Reporting

Global Temperature Report: August 2012 From the University of Alabama At Huntsville

Phil Gentry has provided us with the August 2012 lower tropospheric temperature anomaly analysis from the University of Alabama at Huntsville. It is presented below.

Global Temperature Report: August 2012 [click images below for a clearer image]

Global climate trend since Nov. 16, 1978: +0.14 C per decade

August temperatures (preliminary)

Global composite temp.: +0.34 C (about 0.61 degrees Fahrenheit) above 30-year average for August.

Northern Hemisphere: +0.38 C (about 0.68 degrees Fahrenheit) above 30-year average for August.

Southern Hemisphere: +0.31 C (about 0.56 degrees Fahrenheit) above 30-year average for August.

Tropics: +0.26 C (about 0.47 degrees Fahrenheit) above 30-year average for August.

July temperatures (revised):

Global Composite: +0.28 C above 30-year average

Northern Hemisphere: +0.45 C above 30-year average

Southern Hemisphere: +0.11 C above 30-year average

Tropics: +0.33 C above 30-year average

(All temperature anomalies are based on a 30-year average (1981-2010) for the month reported.)

Notes on data released Sept. 5, 2012:

Compared to global seasonal norms, August 2012 was the third hottest August in the 34-year satellite temperature record, according to Dr. John Christy, a professor of atmospheric science and director of the Earth System Science Center at The University of Alabama in Huntsville. The last three Augusts have been three of the four warmest in the past 34 years, trailing only August 1998 — which was during a major El Nino Pacific Ocean warming event.

An El Nino warming event is still evident in the global temperature maps, stretching out across the tropical and southern Pacific Ocean from the west coast of South America, with temperatures in the tropics warming slightly from July through August.

The coldest and hottest spots on the globe (compared to seasonal norms) weren’t all that far apart in August: The “warmest” area was in the southwestern Atlantic Ocean off the coast of Argentina, where temperatures were as much as 3.43 C (6.17 degrees Fahrenheit) warmer than season norms. The Antarctic winter continues to run colder than normal. Compared to seasonal norms, the “coldest” spot on the globe in August was near the South Pole, with average temperatures as much as 3.38 C (6.08 F) colder than normal for the month.

Global August Temperature Anomalies     1.  1998   0.46   2.  2010   0.44   3.  2012  0.34   4.  2011   0.33   5.  2001   0.25   6.  1995   0.21   7.  2006   0.19   8.  2002   0.17   8.  2007   0.17   8.  2009   0.17 11.  1991   0.14 12.  2005   0.13 13.  2003   0.11 14.  1988   0.09 15.  1980   0.05 15.  1996   0.05 17.  1997   0.02 18.  1983  -0.01 19.  1981  -0.02 20.  1987  -0.04 21.  1990  -0.05 22.  2004  -0.06 22.  2008  -0.06 24.  1999  -0.12 24.  2000  -0.12 26.  1989  -0.13 26.  1994  -0.13 28.  1979  -0.24 29.  1993  -0.25 30.  1982  -0.26 31.  1985  -0.27 32.  1984  -0.28 33.  1986  -0.30 34.  1992  -0.47

Archived color maps of local temperature anomalies are available on-line at:

http://nsstc.uah.edu/climate/

The processed temperature data is available on-line at:

vortex.nsstc.uah.edu/data/msu/t2lt/uahncdc.lt

As part of an ongoing joint project between UAHuntsville, NOAA and NASA, John Christy, a professor of atmospheric science and director of the Earth System Science Center (ESSC) at The University of Alabama in Huntsville, and Dr. Roy Spencer, an ESSC principal scientist, use data gathered by advanced microwave sounding units on NOAA and NASA satellites to get accurate temperature readings for almost all regions of the Earth. This includes remote desert, ocean and rain forest areas where reliable climate data are not otherwise available.

The satellite-based instruments measure the temperature of the atmosphere from the surface up to an altitude of about eight kilometers above sea level. Once the monthly temperature data is collected and processed, it is placed in a “public” computer file for immediate access by atmospheric scientists in the U.S. and abroad.

Neither Christy nor Spencer receives any research support or funding from oil, coal or industrial companies or organizations, or from any private or special interest groups. All of their climate research funding comes from federal and state grants or contracts.

Comments Off on Global Temperature Report: August 2012 From the University of Alabama At Huntsville

Filed under Climate Change Metrics