Category Archives: Climate Change Forcings & Feedbacks

CO2 As A Carbon Fertilizer For Plants – Effects On Surface Global Temperatures” By Luigi Mariani

Today, we have a guest post by Luigi Mariani who is Senior Agrometeorologist with experience in applied meteorology, climatology and mathematical modeling of agro-ecosystems at the Università degli Studi di Milano. It starts as follows

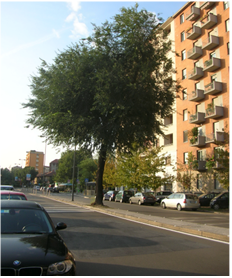
Figure caption– Two examples of heroic vegetation in urban areas. On the top the grass Portulaca oleracea L. and on the bottom the tree Ulmus pumila L. (pictures taken in Milano – Italy).

CO2 as carbon fertilizer for plants – effects on surface global temperatures

By Luigi Mariani

Many things have increased almost monotonously after the end of the Little Ice Age (not only the atmospheric level of CO2 but also the global population, the agricultural production, the solar activity, the global plant biomass, the number of cows and so on). This writing reports some reflections on the effects of terrestrial plant biomass increase on global climate and has been written in order to request suggestions and critics.

The colonization of terrestrial environments by vascular plants began during the Cambrian, about 500 millions of years ago (at that time CO2 levels were 20-30 times the present values) and it is possible to hypothesize an active evolution of plant associations which modified the environment in order to maintain their dominant presence in a growing number of habitats, until a coverage of the main part of the terrestrial areas during warm (greenhouse) phases. Taking into account the Liebig’s law of the minimum it is possible to think that this expansion was locally limited by the availability of chemical elements (first of all nitrogen and phosphorous) but the only real global constraint against the expansion of vegetation has been probably represented by the advent of the glacial periods, from the carboniferous glaciation (380 millions of years ago) until the 15 Pleistocene glaciations (last 2.5 millions of years).

In order to interpret the global vegetation expansion a key element is represented by the homeostasis which is the property of a system that regulates its internal environment and tends to maintain a stable, constant condition of properties like temperature or pH (http://en.wikipedia.org/wiki/Homeostasis). The homeostasis is fundamental for vegetation, natural and cultivated, in order to achieve its final aim which is the reproduction. Clearly homeostatic are for example the effects of closed canopies which maintain stable values of soil temperature (avoiding excesses, negative for roots and microbial activities) and exert a stabilizing effect on the atmospheric canopy layer (limiting evapotranspirational losses and favor the stomatal uptake of CO2 released by soil microbial activities).

The above-mentioned processes are active at microscale but relevant effects on macroscale are present due to the close coupling mechanisms among scales. A naive expression of this phenomenon is the daisyworld example with a planet that rules its albedo changing the % of black and white daisies, an example that pertains to the Gaia hypothesis (http://en.wikipedia.org/wiki/Gaia_hypothesis). Moreover a similitude could be established with the ENSO syndrome, where a boundary layer phenomenon (the abrupt warming of oceanic surface) triggers deep convection propagating El Niño signal to the free atmosphere of the whole planet (ITCZ, Hadley cell, Westerlies, monsoons are affected and the final result is, for example, given by the abrupt global warming of 1998).

After these general presuppositions I’d like to list the following elements:

1) simulations made with the low resolution spectral GCM Puma show that a world completely covered in vegetation would be much warmer – many degrees – compared to a desert world (the work is Planet Simulator: Fraedrich et al, 2005. Green planet and desert word,– http://www.mi.uni-hamburg.de/fileadmin/files/forschung/theomet/planet_simulator/downloads/plasim_mz_2.pdf). By the way this simulation takes into account the following effects of vegetation on climate: surface albedo, surface roughness and soil hydrology.

2) obviously the Fraedrich’s et al work doesn’t take into account the mesoscale effect on cloud coverage which are relevant on global climate because water vapor recycled from evapotranspiration is the main component of the continental precipitation. These effects were  analyzed by

Pielke Sr., R.A., 2001: Influence of the spatial distribution of vegetation and soils on the prediction of cumulus convective rainfall. Rev. Geophys., 39, 151-177. https://pielkeclimatesci.files.wordpress.com/2009/10/r-231.pdf

Pielke, R.A. Sr., J. Adegoke, A. Beltran-Przekurat, C.A. Hiemstra, J. Lin, U.S. Nair, D. Niyogi, and T.E. Nobis, 2007: An overview of regional land use and land cover impacts on rainfall. Tellus B, 59, 587-601.
https://pielkeclimatesci.files.wordpress.com/2009/10/r-315.pdf

Pielke, R.A. and R. Avissar, 1990: Influence of landscape structure on local and regional climate. Landscape Ecology, 4, 133-155. https://pielkeclimatesci.files.wordpress.com/2009/09/r-107.pdf

4) paleo-atmospheric ice core measurements show an increase of the global ecosystem productivity for the Last Glacial Maximum (LGM) vs. Pre Industrial Holocene (PIH) of about 25 / 40% and  model simulations give  a coherent value of +30%. This increase is probably referred only to terrestrial ecosystems because the marine ones show only marginal variations  in the transition from LGM to PIH (Prentice I.C., Harrison P., Bartlein P.J., 2011. Global vegetation and terrestrial carbon cycle changes after the last ice age, New Phytologist (2011) 189: 988–998 – see comments at http://www.co2science.org/articles/V14/N34/EDIT.php)

5) simulations of ancient cereals productions (Araus et al., 2003. Productivity in prehistoric agriculture: physiological models for the quantification of cereal yields as an alternative to traditional Approaches, Journal of Archaeological Science 30, 681–693) show  that the transition of CO2 from pre-industrial 275 ppmv to 350  ppmv increase by 40% the cereal production (and with them, I guess, the production of many natural or cultivated C3).

6) the abovementioned increases of vegetation productivity are questioned by authors that hypothesize a limitation due to other nutrients like nitrogen and phosphorous (Korner C. 2006. Plant CO2 responses: an issue of definition, time and resource supply. New Phytologist 172: 393–411). Nevertheless a relevant global plant biomass increase is stated by satellite data (global net ecosystem productivity from 1982 to 1999 by 6% -> Source: Robert Simmon, NASA Earth Observatory, based on data provided by the University of Montana Numerical Simulations Terradynamic Group (NTSG).  http://earthobservatory.nasa.gov/Features/GlobalGarden/).

7) a diagram of NASA earth observatory  shows that the GW is largely terrestrial (http://earthobservatory.nasa.gov/IOTD/view.php?id=76975&src=eoa-iotd).

8) a metrics suggested by Roger Pielke Sr. to look at the energetic role of vegetation is represented by the moist enthalpy (alias equivalent temperature). For example daytime temperatures are generally reduced over crops during the growing season (even with lower albedo) but the moist enthalpy is higher. See in particular:

Pielke Sr., R.A., C. Davey, and J. Morgan, 2004: Assessing “global warming” with surface heat content. Eos, 85, No. 21, 210-211.
https://pielkeclimatesci.files.wordpress.com/2009/10/r-290.pdf

Davey, C.A., R.A. Pielke Sr., and K.P. Gallo, 2006: Differences between near-surface equivalent temperature and temperature trends for the eastern United States – Equivalent temperature as an alternative measure of heat content. Global and Planetary Change, 54, 19.32
https://pielkeclimatesci.files.wordpress.com/2009/10/r-268.pdf

Fall, S., N. Diffenbaugh, D. Niyogi, R.A. Pielke Sr., and G. Rochon, 2010: Temperature and equivalent temperature over the United States (1979 . 2005). Int. J. Climatol., DOI: 10.1002/joc.2094.
https://pielkeclimatesci.wordpress.com/iles/2010/02/r-346.pdf

A possible deduction from such evidences is that when CO2 increases, also plant biomass grows, so:

1. More water vapour is input so that the latitudinal transport of energy toward the poles is enhanced and also enhanced is the greenhouse effect

2. the global albedo is decreased (the albedo of a desert is higher than that of a ground covered with vegetation).

3. soil water reservoir is emptied faster, so summer drought begins earlier and the H/LE ratio is also increased; on the other hand mesoscale precipitation is enhanced by vegetation, with a decrease of H/LE.

As a final result of this causal chain the H term of the surface energy balance is emphasized and accordingly an increase of air temperature is measured by ground weather stations, giving rise to the general deduction that CO2 could give a positive feed-back on surface global temperatures acting as “fertilizer” for plants.

Two main questions comes from this reasoning:

1. it is possible to have an idea of the significance and of the overall relevance of this phenomenon?

2. Do IPCC GCM simulations take into account the increase in plant biomass, which probably took place in the last 150 years?


Comments Off on CO2 As A Carbon Fertilizer For Plants – Effects On Surface Global Temperatures” By Luigi Mariani

Filed under Climate Change Forcings & Feedbacks, Guest Weblogs

“Comment And Question About Some Research Into Non-Linearity And Climate” By Philip Richens

I was sent a very interesting e-mail by Philip Richens which I have reproduced below with his permission.

Dear Professor Pielke,

I noticed the work of Shaun Lovejoy and his colleagues on non-linearity and climate and thought how relevant it was with respect to your paper with Jose Rial and also to the work of Demetris Koutsoyiannis. I’d be very interested to find out what you think about Lovejoy’s work, if you are happy to offer this opinion. Here is a link to his university web page, http://www.physics.mcgill.ca/~gang/Lovejoy.htm, and here is an informal article outlining some of his group’s current research, http://www.physics.mcgill.ca/~gang/eprints/eprintLovejoy/EOS.12-1-09_Lovejoy.pdf.

A couple of things that particularly caught my eye were:

1/ Identification of distinct weather and climate regimes in temperature series, with scaling found in both regimes. If I understand correctly, this finding supports your idea of climate as an initial value problem, and also is relevant to ice age attribution. See http://www.physics.mcgill.ca/~gang/eprints/eprintLovejoy/neweprint/Emergence.climate.merge.25.10.11.pdf.

2/ Identification of cascades within the atmosphere on all scales. They also find these structures within GCMs, at least down to the grid limits. Possibly this relates to the issue of parametrization of clouds and other small scale processes within GCMs. See http://www.physics.mcgill.ca/~gang/eprints/eprintLovejoy/neweprint/Atmos.Res.8.3.10.finalsdarticle.pdf.

My impression is that this work is important, and yet not widely known. I could find no reference on your blog – even though Koutsoyiannis’ work has featured several times – and I could find no references to it in AR4. I’m simply very interested to find out what you think about it.

Yours sincerely,
Philip Richens

Philip is correct that the work of Shaun Lovejoy has been under-appreciated in the climate science debate. His EOS article, which Philip alerts us to, is

S. Lovejoy, et al. (2009), Nonlinear Geophysics: Why We Need It, Eos Trans. AGU, 90, 48, doi:10.1029/2009EO480003.

The article contains the  text [highlight added]

The undeniable urgency of floods, hurricanes, earthquakes, or climate change (to name a few) has tended to reduce science to a system for the elaboration of “products” and “deliverables” with understanding as an incidental by- product. In comparison, concepts of nonlinear geophysics can provide a rational basis for the statistics and models of natural systems including hazards, which previously were treated by ad hoc methods.”

“….sensitive dependence on initial conditions is now understood to be a commonplace feature of the real world. But the chaos revolution is far from over…..”

The systematic neglect of these resolution dependencies has many consequences including biases in estimating the Earth’s energy budget with implications for climate feedbacks [e.g., Lovejoy et al., 2009]. This is potentially significant because a negative instead of a positive feedback greatly reduces planetary warming due to greenhouse gases [Spencer and Braswell, 2009].”

“….in the absence of societal support for very promising alternative nonlinear approaches, applications will continue to be deprived of this knowledge and resources will continue to be squandered on state- of the- art techniques informed by inappropriate theories. Thus, funding agencies, academic institutions, journal editors, and individual researchers need to see the future potential of nonlinear geophysics to solve science problems that have consistently been beyond the reach of traditional methods. NG methods thus make our understanding of the world more complete.”

Shaun Lovejoy and his co-authors’ comments, and associated research, go to the core of identifying a serious problem with the IPCC-type approach to climate science. 

 The multi-decadal global climate model predictions is NOT a boundary-value problem but an initial value-value problem as I discuss in my post

Climate Science Myths And Misconceptions – Post #4 On Climate Prediction As An Boundary Value Problem

The consequences of the IPCC and others in assuming climate prediction is a boundary-value problem is that they are spending huge amount of funds and computer time on preparing regional climate forecasts of the coming decades for the impacts community that are not only without any skill, but are grossly misleading the public and policymakers on what are climate may be decades from now.

I discuss this failure in a number of weblog posts; e.g.

A Literature Debate On The Lack Of Skill Of Global Climate Model Multi-Decadal Predictions As Reported In The Peer Reviewed Literature By Demetris Koutsoyiannis

Another Scientifically Flawed Claim Of Skillful Multi-Decadal Regional Climate Predictions – This Time It Is In The Intermountain West Climate Summary

The Failure Of Dynamic Downscaling As Adding Value to Multi-Decadal Regional Climate Prediction

Ignored Request For NSF To Respond On The Lack Of Value Of Regional Downscaling Of Climate Forecasts Decades From Now

I appreciate Philip Richens alerting us to the research work of  Shawn Lovejoy and his colleagues.

source of image

Comments Off on “Comment And Question About Some Research Into Non-Linearity And Climate” By Philip Richens

Filed under Climate Change Forcings & Feedbacks, Guest Weblogs

An Example Of Why A Global Average Temperature Anomaly Is Not An Effective Metric Of Climate

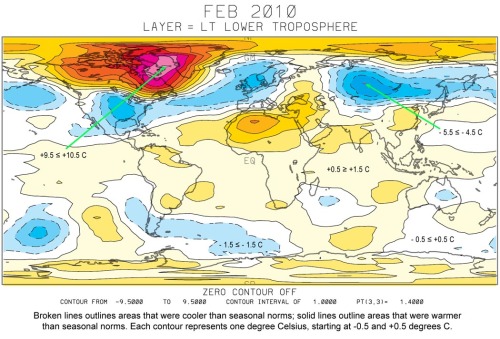
Roy Spencer and John Christy of the University of Alabama at Huntsville have reported in their Global Temperature Report that February 2010 was the 2nd warmest February in 32 years (e.g. see Roy’s summary). [UPDATE: Thanks to Phillip Gentry for providing this figure!]

Their spatial map of the anomalies, however, shows that most of the relative warmth was in a focused geographic area; see

The global average is  based on the summation of large areas of positive and negative temperature anomalies.

As I have reported before on my weblog; e.g. see

What is the Importance to Climate of Heterogeneous Spatial Trends in Tropospheric Temperatures?,

it is the regional tropospheric temperature anomalies that determine the locations of development and movement of weather systems [which are the actual determinants of such climate events as drought, floods, ect] not a global average temperature anomaly.

Comments Off on An Example Of Why A Global Average Temperature Anomaly Is Not An Effective Metric Of Climate

Filed under Climate Change Forcings & Feedbacks, Climate Change Metrics, Uncategorized

New Paper “The Impact Of Urbanization On Current And Future Coastal Precipitation: A Case Study For Houston” By Shepherd Et Al 2010

There is a new paper which demonstrates the role of urban areas in rainfall. It is

J Marshall Shepherd, 2010: The impact of urbanization on current and future coastal precipitation: a case study for Houston, Environment and Planning B: Planning and Design. doi:10.1068/b34102t

The abstract reads

The approach of this study was to determine, theoretically, what impact current and future urban land use in the coastal city of Houston, Texas has on the space and time evolution of precipitation on a `typical’ summer day. Regional model simulations of a case study for 25 July 2001 were applied to investigate possible effects of urban land cover on precipitation development. Simulations in which Houston urban land cover was included resolved rain cells associated with the sea breeze front and a possible urban circulation on the northwest fringe of the city. Simulations without urban land cover did not capture the initiation and full intensity of the `hypothesized’ urban-induced rain cell. The response is given the terminology the `urban rainfall effect’ or URE. An urban growth model (UrbanSim) was used to project the urban land-cover growth of Houston, Texas from 1992 to 2025. A regional atmospheric-land surface model was then run with the 2025 urban land-cover scenario. Though we used a somewhat theoretical treatment, our results show the sensitivity of the atmosphere to urban land cover and illustrate how atmosphere ^ land interactions
can affect cloud and precipitation processes. Two urban-induced features, convergence zones along the inner fringe of the city and an urban low-pressure perturbation, appear to be important factors that lead to enhanced rain clouds independently or in conjunction with the sea breeze. Simulations without the city (NOURBAN) produced less cumulative rainfall in the west-northwest Houston area than simulations with the city represented (URBAN). Future urban land-cover growth projected by UrbanSim (URBAN2025) led to a more expansive area of rainfall, owing to the extended urban boundary and increased secondary outflow activity. This suggests that the future urban land cover might lead to temporal and spatial precipitation variability in coastal urban microclimates. It was beyond the scope of the analysis to conduct an extensive sensitivity analysis of cause ^ effect relationships, though the experiments provide some clues as to why the rainfall evolution differs. This research demonstrates a novel application of urban planning and weather ^ climate models. It also raises viable questions concerning future planning strategies in urban environments in consideration of hydroclimate changes.”

The concluding paragraph of the paper reads

“As concern grows about the impact of human processes on climate change, water cycle accelerations, and precipitation variability, it is important to place urban processes into the context of regional and global climate system processes. Finally, urban rainfall processes have profound implications for surface runoff, water resource management, agriculture, weather forecasting, and urban planning.”

Comments Off on New Paper “The Impact Of Urbanization On Current And Future Coastal Precipitation: A Case Study For Houston” By Shepherd Et Al 2010

Filed under Climate Change Forcings & Feedbacks, Research Papers

Our Paper “Impacts Of Land Use Land Cover Change On Climate And Future Research Priorities” By Mahmood Et Al. 2010 Has Appeared

Our paper

Mahmood, R., R.A. Pielke Sr., K.G. Hubbard, D. Niyogi, G. Bonan, P. Lawrence, B. Baker, R. McNider, C. McAlpine, A. Etter, S. Gameda, B. Qian, A. Carleton, A. Beltran-Przekurat, T. Chase, A.I. Quintanar, J.O. Adegoke, S. Vezhapparambu, G. Conner, S. Asefi, E. Sertel, D.R. Legates, Y. Wu, R. Hale, O.W. Frauenfeld, A. Watts, M. Shepherd, C. Mitra, V.G. Anantharaj, S. Fall,R. Lund, A. Nordfelt, P. Blanken, J. Du, H.-I. Chang, R. Leeper, U.S. Nair, S. Dobler, R. Deo, and J. Syktus, 2010: Impacts of land use land cover change on climate and future research priorities. Bull. Amer. Meteor. Soc., 91, 37–46, DOI: 10.1175/2009BAMS2769.1

has appeared in print (see our earlier announcement about it) which I repeat with some added text from the article here

The paper starts with the text

“Human activities have modified the environment for thousands of years. Significant population increase, migration, and accelerated socio-economic activities have intensified these environmental changes over the last several centuries. The climate impacts of these changes have been found in local, regional, and global trends in modern atmospheric temperature records and other relevant climatic indicators.”

In our conclusions, we write

“As documented in this essay, we conclude that the finding of the National Research Council report (NRC 2005) that LULCC represents a first-order human climate forcing is a robust statement. LULCC effects must be assessed in detail as part of all future climate change assessments, including the forthcoming IPCC Fifth Assessment, in order for them to be scientifically complete. This includes not only climate effects in the regions where LULCC occurs, but also their role in altering hemispheric and global atmospheric and ocean circulations at large distances from the location of LULCC. We also conclude that a regional focus is much more appropriate in order to better understand the human effects on climate, including LULCC. It is the regional responses, not a global average, that produce drought, floods, and other societally important climate impacts.”

as well as make the following recommendations

“…..we recommend, as a start, to assess three new climate metrics:

1. The magnitude of the spatial redistribution of land surface latent and sensible heating (e.g., see Chase et al. 2000; Pielke et al. 2002). The change in these fluxes into the atmosphere will result in the alteration of a wide variety of climate variables including the locations of major weather features. For example, Takata et al. (2009) demonstrated the major effect of land use change during the period 1700-1850 on the Asian monsoon. As land cover change accelerated after 1850 and continues into the future, LULCC promises to continue to alter the surface pattern of sensible and latent heat input to the atmosphere.

2. The magnitude of the spatial redistribution of precipitation and moisture convergence (e.g., Pielke and Chase 2003). In response to LULCC, the boundaries of regions of wet and dry climates can change, thereby affecting the likelihood for floods and drought. This redistribution can occur not only from the alterations in the patterns of surface sensible and latent heat, but also due to changes in surface albedo and aerodynamic roughness (e.g., see Pitman et al. 2004; Nair et al. 2007).

3. The normalized gradient of regional radiative heating changes. Since it is the horizontal gradient of layer-averaged temperatures that force wind circulations, the alteration in these temperatures from any human climate forcing will necessarily alter these circulations. In the evaluation of the human climate effect from aerosols, for example, Matsui and Pielke (2006) found that, in terms of the gradient of atmospheric radiative heating, the role of human inputs was 60 times greater than the role of the human increase in the well-mixed greenhouse gases. Thus, this aerosol effect has a much more significant role on the climate than is inferred when using global average metrics. We anticipate a similar large effect from LULCC. Feddema et al. (2005), for example, have shown that global averages mask the impacts on regional temperature and precipitation changes. The above climate metrics can be monitored using observed data within model calculations such as completed by Matsui and Pielke (2006) for aerosols, as well as by using reanalyses products, such as performed by Chase et al (2000) with respect to the spatial pattern of lower tropospheric heating and cooling. They should also be calculated as part of future IPCC and other climate assessment multi-decadal climate model simulations.”

We also write

“With respect to surface air temperatures, for example, there needs to be an improved quantification of the biases and uncertainties in multi-decadal temperature trends, which remain inadequately evaluated in assessment reports such as from the Climate Change Science Program (CCSP 2006). We also recommend that independent committees (perhaps sponsored by the National Science Foundation) conduct these assessments.”

An important message from our paper is the number of  outstanding climate scientists who co-authored our recommendations.

Comments Off on Our Paper “Impacts Of Land Use Land Cover Change On Climate And Future Research Priorities” By Mahmood Et Al. 2010 Has Appeared

Filed under Climate Change Forcings & Feedbacks, Research Papers

A Paper On The Limits Of Seasonal Weather Prediction And Relevance To Longer Term Climate Predictions By Lavers Et Al 2009

There is a paper by

Lavers, D., L. Luo, and E. F. Wood (2009), A multiple model assessment of seasonal climate forecast skill for applications, Geophys. Res. Lett., 36, L23711, doi:10.1029/2009GL041365. [thanks to Jos de Laat for alerting us to it!].

The paper includes a very important conclusion on what is achievable in terms on seasonal (and thus) longer term forecast skill.

The abstract reads

“Skilful seasonal climate forecasts have potential to affect decision making in agriculture, health and water management. Organizations such as the National Oceanic and Atmospheric Administration (NOAA) are currently planning to move towards a climate services paradigm, which will rest heavily on skilful forecasts at seasonal (1 to 9 months) timescales from coupled atmosphere-land-ocean models. We present a careful analysis of the predictive skill of temperature and precipitation from eight seasonal climate forecast models with the joint distribution of observations and forecasts. Using the correlation coefficient, a shift in the conditional distribution of the observations given a forecast can be detected, which determines the usefulness of the forecast for applications. Results suggest there is a deficiency of skill in the forecasts beyond month-1, with precipitation having a more pronounced drop in skill than temperature. At long lead times only the equatorial Pacific Ocean exhibits significant skill. This could have an influence on the planned use of seasonal forecasts in climate services and these results may also be seen as a benchmark of current climate prediction capability using (dynamic) couple models.”

The discussion part of the paper has the very important finding (which comments on climate predictions)

“Given the actual skill demonstrated by operational seasonal climate forecasting models, it appears that only through significant model improvements can useful long-lead forecasts be provided that would be useful for decision makers – a quest that may prove to be elusive.”

Comments Off on A Paper On The Limits Of Seasonal Weather Prediction And Relevance To Longer Term Climate Predictions By Lavers Et Al 2009

Filed under Climate Change Forcings & Feedbacks, Climate Models, Research Papers

Comments On “Oscilloscope – Britain’s Cold Snap Is Explained By The Arctic Oscillation” in the Economist

UPDATE: Feb 10 2010

The author of the article below has sent me a follow up which I have posted below with his permission. I appreciate his taking time time to follow up and clarify.

Dear Dr Pielke

I fear our article may not have been well expressed, because I think you have misinterpreted it. The point of the line “The atmosphere is not just about temperature, though. Wind patterns matter too” was not to deny the fundamental temperature/pressure/wind field link, but to say that while the temperature patterns associated with the negative phase of the oscillation might tend to decay ice, the wind patterns associated with the same phase might tend to preserve it. I’m sorry that wasn’t clear.

Best wishes

Oliver Morton
Energy and Environment Editor
The Economist

*******************************************

The Economist has an interesting article in their January 11 2010 issue titled

Oscilloscope – Britain’s cold snap is explained by the Arctic oscillation

which (correctly) reports that the recent cold and snowy weather in the UK (and elsewhere) is a result of regional atmospheric circulation patterns. Excerpts from the article read

“IT IS an ill wind that blows no good, as people have been remarking to each other since at least the 16th century. In the case of the bitter easterlies that have brought Britain colder, snowier weather than has been seen for a couple of decades…”

“The atmosphere cannot make heat, or even hold that much of it. There is more heat stored in the top four metres of the oceans than in all the Earth’s atmosphere. 

So when the atmosphere cools down one part of the globe, it is a good rule of thumb that it is warming some other part. In the case of the current mid-latitude chill, it is the high latitudes that are seeing the warming. In Greenland and the Arctic Ocean, December was comparatively balmy. The air above Baffin Bay and the Davis Strait was 7ºC warmer than usual (though that still left it pretty cold).

This pole-centred roundel of warm-in-cold is symptomatic of what climatologists call the negative phase of the Arctic oscillation (AO). It is a mode of atmospheric circulation in which the stratosphere is unusually warm and westerly winds, which normally bring warmth from the oceans to northern Europe, are unusually weak.”

However, there is a significant misunderstanding that is presented in the article. It is written that

“The atmosphere is not just about temperature, though. Wind patterns matter too.”

The article is correct that wind patterns matter (as this is what transports the cold air from the higher latitudes and warm air from lower latitudes). However, the wind pattern is determined by the three-dimensional wind field.  This temperature field creates the three dimensional pressure field, and this pressure field produces the wind patterns. This is well understood in synoptic meteorology, as I have summarized in my lecture notes

Pielke Sr., R.A. 2002: Synoptic Weather Lab Notes. Colorado State University, Department of Atmospheric Science Class Report #1, Final Version, August 20, 2002.

The cold air in the troposphere at higher latitudes, for example, is why the winds in the middle and upper troposphere generally blow from west to east (i.e. the “westerly jet stream; also called the “polar jet”). This also explains why these winds are stronger in the winter than in the summer, since the higher latitudes are colder in the winter.  If you fly from New York to London, you typically arrive more quickly than when you fly from London to New York. The Arctic Oscillation which is the reason for the cold snowy period in the UK is a result of the spatial distribution of tropospheric temperatures.

Thus, despite the implication in the Economist article that wind patterns are distinct from the temperatures, they are intimately related to each other with the temperature field determining the wind patterns. This is why alterations in the spatial pattern of diabatic heating by human activity, such as we identified in our paper

Matsui, T., and R.A. Pielke Sr., 2006: Measurement-based estimation of the spatial gradient of aerosol radiative forcing. Geophys. Res. Letts., 33, L11813, doi:10.1029/2006GL025974.

is so important.  These alterations affect the wind field, and thus the weather than is experienced regionally. This is a much more important issue than changes in the global average surface temperature in terms of the effects on society and the environment.


Comments Off on Comments On “Oscilloscope – Britain’s Cold Snap Is Explained By The Arctic Oscillation” in the Economist

Filed under Climate Change Forcings & Feedbacks, Climate Change Metrics

Reply to Andrew Dessler’s Guest Post On Water Vapor Feedback

Yesterday, Andrew Dessler graciously presented his viewpoint on the water vapor feedback (see).  Today, I want to respond.

The first issue he raised is

1. Do observations indicate that the water vapor feedback strong and positive?

I completely agree with Andrew that, by itself, added water vapor is a positive feedback. We even see this on the local scale where minimum temperatures do not decrease at night as much when the air overhead is more humid.

However, the net effect of the water vapor feedback requires consideration of the other two phases of water (liquid and solid), in which our understanding is significantly incomplete. Andrew also raises this issue in his comment where he writes “[m]y opinion is that the cloud feedback is the only place where such a large negative feedback can lurk.”

The focus specifically on added CO2, though, as a source of a positive water vapor feedback ignores that any warming of the climate  (such as from black carbon; e.g. see and see) must also necessarily result in such a positive water vapor feedback based on Andrew’s conclusions. Similarly, the human climate cooling forcings, such as from sulphates (e.g. see last paragraph), must result in a negative water vapor feedback.  Even the diurnal variation of the Earth’s temperature (e.g. see) would result in positive and negative water vapor feedbacks within a year.

In terms of peer-reviewed papers which examine the water vapor feedback issue, Andrew too quickly dismisses the Wu et al 2009 paper. While this study does focus in the region 5°N-5°S, 150°E-110°W, this is in the El Nino/La Nina region where the relatively high sea surface temperatures means that the water vapor feedback is particularly amplified (evaporation, of course,  is proportional to the exponent of temperature). Slight changes in temperature in this region have a disproportionately larger effect than the same temperature change would have when the water surface is cold.

There are also studies which do not show a concurrent warming and moistening of the atmosphere, at least on the regional scale; see

Wang, J.-W., K. Wang, R.A. Pielke, J.C. Lin, and T. Matsui, 2008: Towards a robust test on North America warming trend and precipitable water content increase. Geophys. Res. Letts., 35, L18804, doi:10.1029/2008GL034564,

as well as vertical profiles of total column water vapor which do not show a long term moistening trend at particular sampling locations;  e.g. see the figure provided by F. M. Mims III in

Climate Metric Reality Check #3 – Evidence For A Lack Of Water Vapor Feedback On The Regional Scale

There is also a fundamental issue with overstating the role of water vapor as a positive feedback. If the feedbacks are positive, the resulting radiative imbalance should be greater than the sum of the radiative forcings.  I discussed this, for example, in my posts

The Net Climate Feedbacks Must Be A Negative Effect On The Global Average Radiative Imbalance If The IPCC Conclusion Of Net Anthropogenic Radiative Forcings Is Correct

Climate Metric Reality Check #1 – The Sum Of Climate Forcings and Feedbacks Is Less Than The 2007 IPCC Best Estimate Of Human Climate Forcing Of Global Warming

I wrote in the above post

“One of the issues is whether climate feedbacks amplify or mute radiative forcings caused by human activities. The IPCC asserts that climate feedbacks in fact amplify the human effect. We can test this assertion using observational data.

If the magnitude of the IPCC estimates of radiative forcings from human causes are greater than or equal to the sum of the total observed radiative forcings and feedbacks (i.e. the total climate system radiative imbalance), then the feedbacks have actually reduced the effect of radiative forcings caused by human activities. By contrast, if the magnitude of radiative forcing caused by humans is less than the sum of the total observed radiative forcings and feedbacks than the feedbacks have amplified the human radiative forcings.

…….. the information that is used [to examine this] is

1. Total Radiative Forcing from Human Causes

The radiative forcings from human causes are provided by the 2007 IPCC Report [see page 4 of the Statement for Policymakers; Fig. SPM.2].

Their value is +1.6 [with a range of +0.6 to +2.4 Watts per meter squared]

This value, as reported in a footnote in the IPCC report, is supposed to be a difference with between current and pre-industrial values (but note that that this is not what is stated in the figure caption).

2. Total Observed Radiative Forcings and Feedbacks

Ocean heat content data can be used to diagnose the actual observed climate forcings and feedbacks [Pielke Sr., R.A., 2003: Heat storage within the Earth system]. Here I will use Jim Hansen’s value for the end of the 1990s of

+0.85 Watts per meter squared

(even though this is probably an overstatement (see)).

Thus, the total observed radiative forcing and feedback of 0.85 W/m^2 lies below the IPCC central estimate of 1.6 W/m^2 for just the human contribution to radiative forcing. This suggests that the climate feedbacks most likely act to diminish the effects of human contributions to radiative forcing, though it is important to recognize that a small part of the IPCC range (0.6 to 0.85) falls under the observed value from the work of Hansen.

This suggests that, at least up to the present, the effect of human climate forcings on global warming has been more muted than predicted by the global climate models.

This issue was inadequately discussed by the 2007 IPCC report. Climate Science has weblogged on this in the past (e.g. see), but so far this rather obvious issue has been ignored.

The second question is

2. Do models adequately reproduce the observed feedback?

There have been a number of studies which raise questions on the robustness of the IPCC-type models to skillfully represent the water vapor feedback. I reported on one study in my post

Major Issues With The Realism Of The IPCC Models Reported By Graeme Stephens Of Colorado State University

Among the findings that Graeme Stephens reported are

  • Model low, warm cloud optical and radiative properties are significantly different (biased) compared to those observed – two factors contribute to this extreme (bright) bias ‐ the LWP [liquid water path] is one, particle size is another.
  • Models contain grave biases in low cloud radiative properties that bring into question the fidelity of feedbacks in models
  • While I believe the changes that are likely to occur are primarily driven by changes in the large scale atmospheric flows, we have to conclude our models have little or no ability to make credible projections about the changing character of rain and cannot conclusively test this hypothesis.

The paper Wang et al 2009 that I posted on (see) on this subject is another study which raises serious issues with the modeling of the water vapor feedback.

Thus, the magnitude of the water vapor feedback, when clouds and precipitation are included, along with other climate system feedbacks, such as atmospheric-ocean interfacial fluxes, remains an incompletely understood subject.

I thank again Professor Dessler for engaging in a constructive dialog on this subject.

Comments Off on Reply to Andrew Dessler’s Guest Post On Water Vapor Feedback

Filed under Climate Change Forcings & Feedbacks, Research Papers

Guest Post By Andrew Dessler On The Water Vapor Feedback

Professor Andrew Dessler of the Department of Atmospheric Sciences of Texas A&M University requested the opportunity to respond to my post

Q & A Are Water Vapor Feedbacks From Added CO2 Well Understood?

I welcome his openess to discuss this issue, and am glad to post his guest weblog. We need more such collegial debate on these topics within the climate community. I will respond in an upcoming post.

Guest Weblog By Andrew Dressler

In a recent post, Prof. Pielke emphasized the uncertainties in our knowledge of the water vapor feedback. In doing so, he failed to recognize the many things that are confidently known about the water vapor feedback.

There are really two questions here: 1) do observations indicate that the water vapor feedback strong and positive, and 2) do models adequately reproduce the observed feedback?

For the first question, the evidence of a strong and positive water vapor feedback is overwhelming. Observations of the response of the atmosphere to events like the eruption of Mount Pinatubo and El Niño cycles show quite clearly that changes in water vapor lead to enhanced trapping of infrared radiation when the climate warms [Soden et al., 2002; Soden et al., 2005; Forster and Collins, 2004; Dessler et al., 2008].  For a more complete summary of why we’re so confident, see Dessler et al. [2009]

It is particularly worth noting that the papers that Prof. Pielke referenced by Dr. Sun and colleagues (which he says casts doubt on models’ ability to simulate the feedback) clearly confirm with observations that the water vapor feedback is strong and positive. 

Given the strong water vapor feedback seen in observations (~2 W/m2/K), combined with estimates of the smaller ice-albedo and lapse rate feedbacks, we can estimate warming over the next century will be several degrees Celsius.  You do not need a climate model to reach this conclusion — you can do a simple estimate using the observed estimates of the feedbacks along with an expectation that increases in carbon dioxide will result in an increase in radiative forcing of a few watts per square meter.

The only way that a large warming will not occur in the face of these radiative forcing is if some presently unknown negative feedback that cancels the water vapor feedback.  My opinion is that the cloud feedback is the only place where such a large negative feedback can lurk.  If it is not there, and the planet does not reduce emissions, then get ready for a much warmer climate.

This brings us to the second question, whether models adequately simulate the feedback.

To investigate this, I have recently compared the global-average radiative response to changes in water vapor during El Niño cycles in climate models to that in reanalyses [Dessler and Wong, 2009]. While the details of the comparison are rich, it’s clear that climate models are doing a good job reproducing the radiative response of changes in water vapor to changes in the tropical surface temperature. 

Prof. Pielke points to some Sun et al. papers to argue that the models are overestimating the feedback.  What he fails to mention is that these papers only analyzed a small region of the planet (e.g., the Wu et al. paper looked at 5°N-5°S, 150°E-110°W, corresponding to about 2.4% of the surface area of the globe) and the “overestimate” they found was quite small. 

Thus, it is a stretch to view the Sun et al. papers as demonstrating some pathological problem with the models’ water vapor feedback, or that this contradicts my global analysis.

The upshot

Thus, we can conclude with extremely high confidence that the water vapor feedback is strong and positive (I would categorize it, in the IPCC’s parlance, as being unequivocal). And I would categorize it as very likely that models are accurately simulating this phenomenon.  While uncertainties do exist (as Prof. Pielke pointed out), those uncertainties are small (which Prof. Pielke fails to point out).  Given this, the most likely outcome of a business-as-usual emissions scenario is significant warming of several degrees Celsius.

Finally, some frequently asked questions about the water vapor feedback:

Didn’t a recent paper show that the water vapor feedback is negative?

There is a recent paper by Paltridge et al. [2009] that shows that water vapor in the tropical upper troposphere in the NCEP/NCAR reanalysis decreased over the past few decades.  I have repeated this calculation with more modern and sophisticated reanalysis data sets (ECMWF interim reanalysis and MERRA reanalysis) and this result does not hold in those data sets.  Given all of the other evidence that the water vapor feedback is positive, all of the ways that long-term trends in reanalyses can be wrong, and lack of verification in more reliable reanalysis data sets, I conclude that the Paltridge et al. result is almost certainly wrong.

Models have biases in their water vapor fields.  Doesn’t this mean their feedbacks are unreliable?

The models do indeed have biases in their predictions of the water vapor base state (it varies from model to model and regionally within a model, but is generally of order 10%) [John and Soden, 2007].  Yet they all simulate about the same water vapor feedback.  How can that be?  It turns out that the water vapor feedback is determined by the fractional change in water vapor, primarily in the tropical upper troposphere. And the models all calculate the same fractional change in water per degree of surface warming [John and Soden, 2007]. This is why they all get basically the same water vapor feedback, despite biases in the predicted base state.

Why is the tropical upper troposphere so important for the water vapor feedback?

It is the changes in water vapor in the tropical upper troposphere that plays the major role in the water vapor feedback. While photons from these water vapor molecules do not directly heat the surface, they do primarily regulate emission of energy to space.  Because the troposphere is rapidly mixed by convection at a rate much faster than radiation, the effect of changes due to radiation fluxes that are entirely internal to the troposphere (e.g., due to changes in lower tropospheric water) will be rapidly wiped out by convection and have a small net impact on surface temperature.  The tropics dominate the effect because of the smaller temperature difference between the surface and the upper troposphere in the mid-latitudes combined with smaller column abundances of water vapor there. 

Dessler, A. E., and S. C. Sherwood (2009), A matter of humidity, Science, 323, doi: 10.1126/Science.1171264, 1020-1021. http://geotest.tamu.edu/userfiles/216/dessler09.pdf

Dessler, A. E., and S. Wong (2009), Estimates of the water vapor climate feedback during the El Niño Southern Oscillation, J. Climate, 22, doi: 10.1175/2009JCLI3052.1, 6404-6412. http://geotest.tamu.edu/userfiles/216/dessler09b.pdf

Dessler, A. E., P. Yang, and Z. Zhang (2008), The water-vapor climate feedback inferred from climate fluctuations, 2003-2008, Geophys. Res. Lett., 35, L20704, doi: 10.1029/2008GL035333. http://geotest.tamu.edu/userfiles/216/Dessler2008b.pdf

Forster, P. M. D., and M. Collins (2004), Quantifying the water vapour feedback associated with post-Pinatubo global cooling, Climate Dynamics, 23, 207-214.

John, V. O., and B. J. Soden (2007), Temperature and humidity biases in global climate models and their impact on climate feedbacks, Geophys. Res. Lett., 34, L18704, doi: 10.1029/2007GL030429.

Paltridge, G., A. Arking, and M. Pook (2009), Trends in middle- and upper-level tropospheric humidity from NCEP reanalysis data, Theor. Appl. Climatol., doi: 10.1007/s00704-009-0117-x, 351-359.

Soden, B. J., R. T. Wetherald, G. L. Stenchikov, and A. Robock (2002), Global cooling after the eruption of Mount Pinatubo: A test of climate feedback by water vapor, Science, 296, 727-730.

Soden, B. J., D. L. Jackson, V. Ramaswamy, M. D. Schwarzkopf, and X. Huang (2005), The radiative signature of upper tropospheric moistening, Science, 310, 841-844.

Comments Off on Guest Post By Andrew Dessler On The Water Vapor Feedback

Filed under Climate Change Forcings & Feedbacks, Guest Weblogs

Q & A Is Global Warming The Same As Climate Change?

Today’s question:  “Is Global Warming The Same As Climate Change?

The answer is clearly NO.

We continue, however,  to see the use of climate change and global warming used interchangeably (e.g. see).  This is presumably based on the narrow, and scientifically flawed, perspective advocated in policy statements as this (see)

“Observations throughout the world make it clear that climate change is occurring, and rigorous scientific research demonstrates that the greenhouse gases emitted by human activities are the primary driver. “

However, as documented in the EOS article

Pielke Sr., R., K. Beven, G. Brasseur, J. Calvert, M. Chahine, R. Dickerson, D. Entekhabi, E. Foufoula-Georgiou, H. Gupta, V. Gupta, W. Krajewski, E. Philip Krider, W. K.M. Lau, J. McDonnell,  W. Rossow,  J. Schaake, J. Smith, S. Sorooshian,  and E. Wood, 2009: Climate change: The need to consider human forcings besides greenhouse gases. Eos, Vol. 90, No. 45, 10 November 2009, 413. Copyright (2009) American Geophysical Union

“……. the natural causes of climate variations and changes are undoubtedly important, [but also] the human influences are significant and involve a diverse range of first- order climate forcings, including, but not limited to, the human input of carbon dioxide (CO2). Most, if not all, of these human infl uences on regional and global climate will continue to be of concern during the coming decades.”

I have posted on the need to broaden the science assessment for years, with examples of my posts on this topic

Is Global Warming the Same as Climate Change?

What is Climate? Why Does it Matter How We Define Climate?

What is Climate Change?

Is There a Human Effect on the Climate System?

What Are The Major Recommendations of the 2005 National Research Council Report Entitled Radiative Forcing of Climate Change: Expanding The Concept And Addressing Uncertainties?

The bottom line message is that climate change involves much more than global warming or cooling. When the two terms are used interchangeably it shows either a lack of knowledge or a deliberate attempt to mislead policymakers and the public.

Comments Off on Q & A Is Global Warming The Same As Climate Change?

Filed under Climate Change Forcings & Feedbacks, Climate Science Misconceptions