Category Archives: Climate Science Reporting

September 2012 Lower Tropospheric Temperature Anomaly Analysis From The University of Alabama At Huntsville

Phillip Gentry has provided us with the September 2012 lower tropospheric temperature anomaly analysis from the University of Alabama at Huntsville. It is presented below [click each image for a clearer view]. Note the large spatial variations in the temperature anomalies.

Global Temperature Report: August 2012

Changing satellites as instruments die

Global climate trend since Nov. 16, 1978: +0.14 C per decade

September temperatures (preliminary)

Global composite temp.: +0.34 C (about 0.61 degrees Fahrenheit) above 30-year average for September.

Northern Hemisphere: +0.35 C (about 0.63 degrees Fahrenheit) above 30-year average for September.

Southern Hemisphere: +0.33 C (about 0.59 degrees Fahrenheit) above 30-year average for September.

Tropics: +0.15 C (about 0.22 degrees Fahrenheit) above 30-year average for September.

August temperatures (revised):

Global Composite: +0.21 C above 30-year average

Northern Hemisphere: +0.21 C above 30-year average

Southern Hemisphere: +0.20 C above 30-year average

Tropics: +0.06 C above 30-year average

(All temperature anomalies are based on a 30-year average (1981-2010) for the month reported.)

Notes on data released Oct. 8, 2012:

September 2012 was the third warmest September in the 34-year satellite temperature record, according to Dr. John Christy, a professor of atmospheric science and director of the Earth System Science Center at The University of Alabama in Huntsville. Three of the last four Septembers were warmer than September 1998, during the El Niño Pacific Ocean warming event “of the century.” The last September that was cooler than the 30-year baseline seasonal norm was in 2000.

Compared to seasonal norms, the coldest spot on the globe in September was (again) at the South Pole, where the Antarctic spring temperature averaged 3.31 C (almost 6 degrees Fahrenheit) colder than normal. The “warmest” spot was just north of Monbetsu, Japan, where temperatures in September averaged 3.72 C (about 6.7 degrees Fahrenheit) warmer than seasonal norms.

The temperatures reported in this report are from different instruments than have been used in the recent past, Christy said.

“Some things are just out of our control,” he said. “In the past three years our backbone satellite – NASA’s AQUA, which has been operating since 2002 – has experienced an increase in ‘noise.’ Until now, however, the differences between temperature values recorded by AQUA and two other satellites, NOAA 15 and NOAA 18, were within 0.1 C. That is within our typical margin of error for monthly global values and not of much concern.

“In September, the difference jumped to 0.2 C. Looking at the daily values, that gap was increasing as the month ended. It appears that for our climate project, AQUA is no longer useful.”

AQUA has on-board propulsion that allows it to maintain a stable orbit, which means the temperature data it collected was also stable. Orbital drift (east or west) and orbital decay cause systemic changes in temperature data, either warmer or cooler depending on which way the satellite’s orbit is shifting. While the UAHuntsville team has developed and published techniques for correcting errors caused by orbital drift or decay, data from a satellite in a stable orbit is easier to process and should be more reliable.

There is, however, no technique to correct for a failing instrument.

“We haven’t used NOAA-15 or NOAA-18 in the past few years because they each are drifting in orbit,” Christy said. “NOAA-15 is moving to slightly warmer temperature and NOAA-18 to slightly cooler. It is clear, however, that the slight differences between the temperature values they report (less than 0.1 C) are small and their average will be very close to the actual temperatures, as their errors will cancel each other out.

“We have implemented a simple solution for the data problem, which we will call version 5.5 of the UAHuntsville satellite dataset,” Christy said. “For the data beginning in January 2010 we will use the average of NOAA-15 and NOAA-18, and will leave out AQUA. The only change is the source of data. As it turns out, the long-term global climate trend doesn’t change, because the real problem only developed in the past month.”

The UAHuntsville team is working now on version 6.0 of the dataset, which will more precisely account for issues like the small orbital drifts in NOAA-15 and NOAA-18. There is no schedule for the release of the new dataset: “We are taking our time and having an independent scientist write the new code from scratch, to insure that it is testable and transportable. That takes time. Until the new version is released, the values provided by version 5.5 will give us more accurate information than relying on the instrument on the AQUA satellite.”

Archived color maps of local temperature anomalies are available on-line at:

http://nsstc.uah.edu/climate/

The processed temperature data is available on-line at:

vortex.nsstc.uah.edu/data/msu/t2lt/uahncdc.lt

As part of an ongoing joint project between UAHuntsville, NOAA and NASA, John Christy, a professor of atmospheric science and director of the Earth System Science Center (ESSC) at The University of Alabama in Huntsville, and Dr. Roy Spencer, an ESSC principal scientist, use data gathered by advanced microwave sounding units on NOAA and NASA satellites to get accurate temperature readings for almost all regions of the Earth. This includes remote desert, ocean and rain forest areas where reliable climate data are not otherwise available.

The satellite-based instruments measure the temperature of the atmosphere from the surface up to an altitude of about eight kilometers above sea level. Once the monthly temperature data is collected and processed, it is placed in a “public” computer file for immediate access by atmospheric scientists in the U.S. and abroad.

Neither Christy nor Spencer receives any research support or funding from oil, coal or industrial companies or organizations, or from any private or special interest groups. All of their climate research funding comes from federal and state grants or contracts.

Comments Off on September 2012 Lower Tropospheric Temperature Anomaly Analysis From The University of Alabama At Huntsville

Filed under Climate Change Metrics, Climate Science Reporting

News Article “Cool Roofs May Have Side Effects On Regional Rainfall” By Umair Irfan, E&E reporter

Figure from Irfan 2012

There is an E & E Publishing, LLC news article that has appeared. It is by Umair Irfan, E&E reporter titled

Cool roofs may have side effects on regional rainfall

It reads [higlight added]

ClimateWire: Wednesday, October 3, 2012

As desert sands yield to asphalt and concrete, the climate is shifting in Arizona’s “Sun Corridor,” an expanding urban region that includes Phoenix, Tucson, Prescott and Nogales. Researchers are now finding that efforts to offset the climate shift may carry side effects of their own.

Towering buildings, dark roads and sparse vegetation combine to trap heat, making cities warmer than surrounding areas. Previous studies showed that these effects are profound. “What we saw was that urbanization-induced warming is just as important as greenhouse gas-induced climate change,” said Matei Georgescu, an assistant professor in the School of Geographical Sciences and Urban Planning at Arizona State University.

State planners expect the cities in Arizona’s “Sun Corridor” to fuse into a megalopolis by 2050. Click the map for a larger version. Photo courtesy of the University of Arizona.

In a study published last month in the journal Environmental Research Letters, Georgescu demonstrated that these effects change with the seasons and have consequences for regional hydrology, as well. “There’s more to it than just average temperature.”

The Sun Corridor is a good test case, according to Georgescu; it is the fastest-growing “megapolitan” region in the United States. How much population and development growth there will be is uncertain, so Georgescu and his team set a floor and a ceiling for urbanization projections up to the year 2050 based on available data from the Maricopa Association of Governments, the regional agency in charge of long-term planning.

The researchers found that cities would generate the most warming during the summers under the maximum development scenario, with warming exceeding 1 degree Celsius. Under the minimum development projections, warming ranged from 0.1 to 0.3 degrees Celsius for most of the year outside winter.

The models also showed another curious development: Cool roofs — created when developers use reflective paint on rooftops — do perform their intended task of reducing temperatures in urban areas while cutting building energy costs. However, they shift rainfall patterns by reducing evapotranspiration, the process by which water evaporates from the ground and enters the atmosphere. In the maximum expansion scenario, cool roofs led to a 4 percent decline in rainfall.

Modifying CO2 footprint can modify the weather

“Does that suggest that cool roofs are a negative? I think what this leads to is future research to see how they should place cool roofs to minimize impacts,” Georgescu said. “Certain regions might be more appropriate for cool roofs than others.”

Some changes in rain patterns also stem from development itself. “When you put this carpet of urban land use, you’re forbidding the land from capturing and storing the water,” Georgescu said. “We’ve shown in some of our previous work that locally recycled water is very important for regional rainfall.”

Roger Pielke [Sr.], a senior research scientist at the Cooperative Institute for Research in Environmental Sciences at the University of Colorado, Boulder, noted that offsetting or mitigating humanity’s impacts on the world often carries unintended consequences. “Any geoengineering approach will have other effects as well as for the one it is designed to respond to,” he said in an email.

He pointed to research that showed how wind turbines alter regional temperatures even as they reduce carbon emissions that contribute to global climate change. Such trends mean scientists and policymakers will have to factor in how synthetic climate forcers other than greenhouse gases will change temperature, rainfall and weather extremes.

To solve this problem, Pielke suggested measuring environmental variables from a regional scale up to a global scale as a more inclusive way to assess environmental risks than the top-down approach used by the Intergovernmental Panel on Climate Change.

“This vulnerability concept requires the determination of the major threats to local and regional water, food, energy, human health, and ecosystem function resources from extreme events including climate, but also from other social and environmental issues,” he said in a book chapter he co-authored in “Extreme Events and Natural Hazards: The Complexity Perspective” earlier this year.

For now, Georgescu said, he will concentrate on regional modeling because global climate models do not yet offer enough resolution to illuminate climate trends in areas like the Sun Corridor. Conducting similar studies in multiple regions around the world could help climate modelers improve their global projections and help planners anticipate local climate shifts.

Comments Off on News Article “Cool Roofs May Have Side Effects On Regional Rainfall” By Umair Irfan, E&E reporter

Filed under Climate Change Forcings & Feedbacks, Climate Science Reporting

Comment On “A National Strategy for Advancing Climate Modeling” From The NRC

There is a new and, in my view, scientifically flawed report published by the National Research Council. The report is

 A National Strategy for Advancing Climate Modeling

I have a few comments on this report in my post today which document its failings. First, the overarching perspective of the authors of the NRC report is [highlight added]

As climate change has pushed climate patterns outside of historic norms, the need for detailed projections is growing across all sectors, including agriculture, insurance, and emergency preparedness planning. A National Strategy for Advancing Climate Modeling emphasizes the needs for climate models to evolve substantially in order to deliver climate projections at the scale and level of detail desired by decision makers, this report finds. Despite much recent progress in developing reliable climate models, there are still efficiencies to be gained across the large and diverse U.S. climate modeling community.

My Comment:

First, their statement that “….climate change has pushed climate patterns outside of historic norms” is quite a convoluted statement. Climate has always been changing. This insertion of “climate change” clearly is a misuse of the terminology “climate change” as I discussed in the post

The Need For Precise Definitions In Climate Science – The Misuse Of The Terminology “Climate Change”

Second, there are no reliable climate model predictions on multi-decadal time scale! This is clearly documented in the posts; e.g. see

Comments On The Nature Article “Afternoon Rain More Likely Over Drier Soils” By Taylor Et Al 2012 – More Rocking Of The IPCC Boat

More CMIP5 Regional Model Shortcomings

CMIP5 Climate Model Runs – A Scientifically Flawed Approach

The NRC Report also writes

Over the next several decades, climate change and its myriad consequences will be further unfolding and possibly accelerating, increasing the demand for climate information. Society will need to respond and adapt to impacts, such as sea level rise, a seasonally ice-free Arctic, and large-scale ecosystem changes. Historical records are no longer likely to be reliable predictors of future events; climate change will affect the likelihood and severity of extreme weather and climate events, which are a leading cause of economic and human losses with total losses in the hundreds of billions of dollars over the past few decades.

My Comment:

As I wrote earlier in this post, the multi-decadal climate model predictions have failed to skillfully predict not only changes in climate statistics over the past few decades, but cannot even accurately enough simulate the time averaged regional climates! Moreover, in terms of the comment that

“…climate change will affect the likelihood and severity of extreme weather and climate events, which are a leading cause of economic and human losses with total losses in the hundreds of billions of dollars over the past few decades.”

this is yet another example of where the BS meter is sounding off! See, for example, my son’s most recent discussion of this failing by the this climate community;

The IPCC sinks to a new low

The NRC report continues

Computer models that simulate the climate are an integral part of providing climate information, in particular for future changes in the climate. Overall, climate modeling has made enormous progress in the past several decades, but meeting the information needs of users will require further advances in the coming decades.

They also write that

Climate models skillfully reproduce important, global-to-continental-scale features of the present climate, including the simulated seasonal-mean surface air temperature (within 3°C of observed (IPCC, 2007c), compared to an annual cycle that can exceed 50°C in places), the simulated seasonal-mean precipitation (typical errors are 50% or less on regional scales of 1000 km or larger that are well resolved by these models [Pincus et al., 2008]), and representations of major climate features such as major ocean current systems like the Gulf Stream (IPCC, 2007c) or the swings in Pacific sea-surface temperature, winds and rainfall associated with El Niño (AchutaRao and Sperber, 2006; Neale et al., 2008). Climate modeling also delivers useful forecasts for some phenomena from a month to several seasons ahead, such as seasonal flood risks.

My Comment:  Actually “climate modeling” has made little progress in simulating regional climate on multi-decadal time scales, and no demonstrated evidence of being able to skillfully predict changes in the climate system. Indeed, the most robust work are the peer-reviewed papers that are in my posts (as I also listed earlier in this post)

Comments On The Nature Article “Afternoon Rain More Likely Over Drier Soils” By Taylor Et Al 2012 – More Rocking Of The IPCC Boat

More CMIP5 Regional Model Shortcomings

CMIP5 Climate Model Runs – A Scientifically Flawed Approach

which document the lack of skill in the models.

The report also defines “climate” as

Climate is conventionally defined as the long-term statistics of the weather (e.g., temperature, precipitation, and other meteorological conditions) that characteristically prevail in a particular region.

Readers of my weblog should know that this is an inappropriately narrow definition of climate. In the NRC report

National Research Council, 2005: Radiative forcing of climate change: Expanding the concept and addressing uncertainties. Committee on Radiative Forcing Effects on Climate Change, Climate Research Committee, Board on Atmospheric Sciences and Climate, Division on Earth and Life Studies, The National Academies Press, Washington, D.C., 208 pp.

(which the new NRC report conveniently ignored), climate is defined as

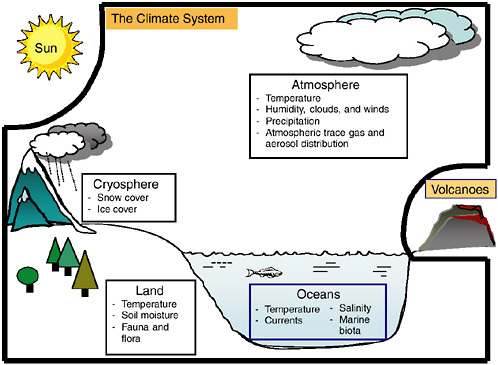
The system consisting of the atmosphere, hydrosphere, lithosphere, and  biosphere, determining the Earth’s climate as the result of mutual interactions  and responses to external influences (forcing). Physical, chemical, and  biological processes are involved in interactions among the components of the  climate system.

FIGURE 1-1 The climate system, consisting of the atmosphere, oceans, land, and cryosphere. Important state variables for each sphere of the climate system are listed in the boxes. For the purposes of this report, the Sun, volcanic emissions, and human-caused emissions of greenhouse gases and changes to the land surface are considered external to the climate system (from NRC, 2005)

This new NRC report “A National Strategy for Advancing Climate Modeling” misrepresents the capabilities of the climate models to simulate the climate system on multi-decadal time periods.

While I am in support of studies that assess the predictability skill of the models and to use them for monthly and seasonal predictions (which can be quickly tested against observations), seeking to advance climate modeling by claiming that more accurate multi-decadal regional forecasts can be made for policymakers and impact scientists and engineer with their proposed approach is, in my view, a dishonest communication to policymakers and to the public.

This need for advanced climate modeling should be promoted only and specifically with respect to assessing predictability on monthly,seasonal and longer time scales, not to making multi-decadal predictions for the impacts communties.

Comments Off on Comment On “A National Strategy for Advancing Climate Modeling” From The NRC

Filed under Climate Science Misconceptions, Climate Science Reporting

A PBS Overreaction

Judy Curry has an excellent post titled

PBS Ombudsman

on her weblog with respect to the response of the PBS Ombudsman, Michael Getler to the appearance of Anthony Watts on PBS’s News Hour. I watched the interview where Anthony did an excellent and clearly articulated presentation of his views (and that of quite a few other climate scientists).

The interview adds to the debate on the climate issue, and those who complained to PBS, in my view, are seeking to suppress the public from seeing there is a diversity of viewpoints on climate from what they typically hear about in the media. The original PBS show was very well done.

Since Judy has already discussed Michael Getler’s response as Ombudsman , I just want to add one comment here.

In the statement by Michael Getler, he wrote

What was stunning to me as I watched this program is that the NewsHour and  Michels had picked Watts — who is a meteorologist and commentator — rather than  a university-accredited scientist to provide “balance.”

What in the world is “a university-accredited scientist?”

If this means that one has to be a faculty member at a University, this definition fails. For example, Alan Betts is an internationally well-respected scientist who has chosen to work by himself.  He  has not been a university faculty member for years.

Could the definition mean you must have a Ph.d? Clearly No. As just one example, Lew Grant, also an internationally well-respected scientist who was a Professor at Colorado State University, but does not have a Ph.d.

Update: I was alerted that Tom Karl, Director of NOAA’s NCDC also does not have a Ph.d.

Could it mean that you have to be a university professor that works in the area of study; in this case climate science. Also, the answer is No. Richard Muller has internationally well-respected credentials in physics, but he is a newcomer to climate science.

In contrast, Anthony Watts has been working in weather and climate for quite a few years, and is clearly well-qualified to discuss the surface temperature siting issues presented in the PBS broadcast. Even Tom Karl at NOAA’s NCDC invited Anthony to give a talk at their headquarters in Asheville several years ago.  Indeed, NCDC has made changes in their network specifically in response to Anthony’s pioneering work on station siting!

The PBS Ombudsman, Michael Getler, clearly has inappropriately reacted to what was a valuable, much-needed (and usually missing from PBS) report on the diversity of perspectives on the climate issue.

source of image

Comments Off on A PBS Overreaction

Filed under Climate Science Reporting

Were 2009 and 2010 The Warmest Years In India Since 1901? By S. Raghavan

UPDATE OCT 13 2012: The article discussed below is available from here – INDIAN METEOROLOGICAL SOCIETY CHENNAI CHAPTER.

S. Raghavan of  the Indian Meteorological Society, Chennai in India has sent us the article below which appeared in the publication Breeze Volume 14 in June 2012. S. Raghavan is a retired Deputy Director-General of Meteorology of the India Meteorological Department. His earlier post on my weblog is

A Perspective on Weather and Climate Science by S. Raghavan

Were 2009 and 2010 the warmest years in India since 1901? by S. Raghavan

1. Warmest years

The India Meteorological Department (IMD) announced in 2010 that 2009 was the warmest year in India since 1901 (Attri and Tyagi, 2010). Again in 2011 it was stated that 2010 was the warmest since 1901 (IMD, 2011). The annual mean temperature for the country as a whole is estimated to have risen by 0.56ºC over the period. This agrees with the widespread perception that the world is warming.

What was the basis for this assessment? The IMD has utilised the records of about 210 surface observatories (including those at major cities) all over India and computed the average of the daily maximum and minimum temperatures at each station. Data have been gridded and weighted average of all grid values has been calculated for the country as a whole. While this is a straightforward process there are certain limitations of the data which need to be considered, as the likely errors in the data could be larger than the “expected” warming due to any climate change.

2. Changes in Land Use

Over the period of more than a century many land use changes have evidently taken place all over the country. The changes in urban areas may be in the form of new structures which can contribute radiation or alter wind circulation. In other areas there can be changes such as development of irrigated lands, change in farming practices, drying up or filling up of water bodies and removal of vegetation. These changes affect the radiation
balance, evaporation, soil moisture and wind flow. The observed increase in temperature can have a component due to land use change and a component due to changes in atmospheric composition and it will be difficult to separate the two.

It is interesting to note that the Inter-Governmental Panel on Climate Change (IPCC) (IPCC, 2012) has recently redefined climate change as

“A change in the state of the climate that can be identified (e.g., by using statistical tests) by changes in the mean and/or the variability of its properties and that persists for an extended period, typically decades or longer. Climate change may be due to natural internal processes or external forcings, or to persistent anthropogenic changes in the composition of the atmosphere or in land use”.

This is different from the previous definition. IPCC states

“This definition differs from that in the United Nations Framework Convention on Climate Change (UNFCCC), where climate change is defined as: “a change of climate which is attributed directly or indirectly to human activity that alters the composition of the global atmosphere and which is in addition to natural climate variability.”

The IMD (Attri and Tyagi, 2010) is therefore correct in listing the trend under “Climate Change Scenario”. However the land use changes in each area and their impact will depend on many factors (meteorological as well as socio-economic) and will be widely different in different areas. Hence the temperature changes may not be compatible among all the stations or the particular station’s own data of earlier decades. An average of the temperatures for the whole country is therefore unlikely to be a good measure of climate change.

3. Deterioration of Exposure Conditions

In case an observatory site is changed, IMD has procedures to compare observations at the new and old sites for ensuring compatibility. But the change in exposure conditions at the same site is difficult to quantify or correct for. In major cities such as Mumbai and Kolkata where the observatories are surrounded by newly developed
roads and buildings, the changes are large and the observatory exposure is drastically affected. In addition to the changes in radiation fluxes and wind flow, even the instruments could have been shadowed in some cases.
It is not often possible to shift the observatory to a more open and representative site to overcome this problem. As different stations are differently affected, the computed country average will be affected.

4. Heat island effect

The heat island effect in cities is well-known. A study organised by the present author at Chennai (Jayanthi , 1991) in the 1980s showed heat island effects of up to 4ºC in some pockets in the minimum temperature epoch in winter. The effect on maximum temperature may be expected to be smaller. The result indicates that the heat island effect
is much larger than any increase which may be expected due to climate change. There may also be effects of changes in local wind circulations due to urban development or due to increasing air pollution. Such an effect will bias the country average.

5. Maximum and minimum temperatures

Maximum and minimum temperatures may be affected differently by land use changes or the heat island effect. Hence an average of the maximum and minimum temperatures may not bring out the correct change over time if any.

6. Network Selection

The basis of selection of the 210 stations for the computation of trend is not clear. Presumably the departmentally manned observatories with long period records which can be expected to have been set up originally with good exposure and yield more reliable data have been selected. Presumably there has been no change in type of instrumentation or observing practices at these stations. These need to be verified.

The USA has a Historical Climate Network consisting of a subset of stations of the National Weather Service for Climate change analysis. But even this is said to have several stations with unsatisfactory exposures (Davey and Pielke, 2005). More recently a U.S. Climate Reference Network (CRN) has been established (Vose et al., 2005). The
IMD also maintains a network of 10 Global Atmosphere Watch stations (GAW, formerly Background Air Pollution Monitoring Network or BAPMoN) as per WMO protocols and standards (Attri and Tyagi 2010). These may perhaps have a record which has not been significantly affected by the above effects but these stations are available only from 1974. They are few in number and widely different in geographical distribution and in topographic characteristics. Hence they may also not be representative of the country. The optimum station density network for assessing trends may need to be determined (See e.g. Voss and Menne, 2004).

7. Correction of data

Evidently while assessing long-term trends the impact of these effects has to be minimised. How is this to be done?

The stations to be included in the analysis can be reviewed to exclude those which are affected by significant heat island effect or exposure deterioration. A station by station check is necessary to exclude those which have poor or non-standard exposures or are unrepresentative in other respects. Techniques for “homogeneity adjustments” have
been suggested (e.g. Easterling et al., 1996). Another method suggested is to use temperature anomalies instead of the temperatures themselves because temperature anomalies are expected to be much more geographically coherent than actual temperatures (Peterson, 2006).The anomaly time series is derived by subtracting the mean
temperature from a base period. Such corrections need to be effected before announcing to the public the rise in the temperatures.

8. Significance and interpretation of temperature trends

How to interpret the trends corrected as suggested and use the information?

There is a widespread view among scientists that near-surface temperature is not the most reliable metric to assess climate change. Other parameters such as ocean heat content have been suggested as most of the energy received by the earth is stored in the oceans (e.g. Ellis et al. 1978). Publishing a temperature trend without interpreting it may cause the public to derive wrong conclusions. For example the public and the media often state and feel during every summer that the current summer is hotter than any they experienced earlier. They interpret this as climate change. This perception is in most cases not correct.

As discussed earlier, whether the observed trend is due to land use change or change in atmospheric composition, it is to be considered as climate change. But the actions to be taken to minimise the trend will be different in the two cases. The meteorological community should be able to advise decision-makers about measures to be taken in the two cases. Any information which goes to users should put these issues in proper perspective.

References

Attri S. D. and A Tyagi, 2010, “Climate Profile of India” by Met Monograph No. Environment Meteorology-01/2010

Davey, C. A., and R. A. Pielke Sr., 2005: Microclimate exposures of surface-based weather stations. Bull. Amer. Meteor. Soc., 86, 497–504.

Easterling, D. R., T. C. Peterson, and T. R. Karl, 1996, On the development and use of homogenized climatological datasets. J. Climate, 9, 1429–1434.

Ellis J. S., T. H. Vonder Haar, S. Levltus and A. H. Oort, 1978, The Annual Variation in the Global Heat Balance of the Earth, J. Geophys. Res., 83, 1958-1962IMD. 2011, Press Release dated 13 January 2011

IPCC, 2012: Summary for Policymakers. In: “Managing the Risks of Extreme Events and Disasters to Advance Climate Change Adaptation” [Field, C.B., V. Barros, T.F. Stocker, D. Qin, D.J. Dokken, K.L. Ebi, M.D. Mastrandrea, K.J. Mach, G.-K. Plattner, S.K. Allen, M. Tignor, and P.M. Midgley (eds.)]. A Special Report of Working Groups I and II of the Intergovernmental Panel on Climate Change. Cambridge University Press, Cambridge, UK, and New York, NY, USA, pp. 1-19. (available on IPCC website).

Jayanthi N., 1991, Heat Island study over Madras city and neighbourhood, Mausam, 42, 1, 83-88.

Vose R.S,, D. R. Easterling, T. R. Karl and M. Helfert, 2005, “Comments on “Microclimate Exposures of Surface-Based Weather Stations”, Bull. Amer. Meteor. Soc., 86, 504-506.

Vose, R. S., and M. J. Menne, 2004: A method to determine station density requirements for climate observing networks. J. Climate, 17, 2961–2971.

source of image

Comments Off on Were 2009 and 2010 The Warmest Years In India Since 1901? By S. Raghavan

Filed under Climate Change Metrics, Climate Science Reporting

My Comment On “The Top American Science Questions: 2012” On “Climate Change”

As announced on my son’s weblog post

Romney vs. Obama in the ScienceDebate

there is an informative set of Q&A between President Obama and Presidential candidate Mitt Romney that appeared in the  article [with the media sponsor Scientific American]

The Top American Science Questions: 2012

The question I am commenting on is

Climate Change.  The Earth’s climate is changing and there is concern about the potentially adverse effects of these changes on life on the planet. What is your position on cap-and-trade, carbon taxes, and other policies proposed to address global climate change—and what steps can we take to improve our ability to tackle challenges like climate change that cross national boundaries?

President Obama answered in part

Climate change is the one of the biggest issues of this generation, and we have to meet this challenge by driving smart policies that lead to greater growth in clean energy generation and result in a range of economic and social benefits….”

President Obama makes the mistake of equating climate change as being dominated by CO2 and other greenhouse gas emissions. Readers of my weblog and my papers know that this is clearly a mistaken view of the role of humans in the climate system; e.g. see also the post by Chris Rapley who wrote

“I agree completely that human greenhouse gas emissions are only part of the climate change story, and that climate change is only a subset of the broader issue of human disturbance of the Earth system.”

and also

“….we have…left ourselves in the awkward position should policy makers address and deal with CO2 emissions of then having to say – “oh and by the way, there are these other issues too…”

Presidential candidate Mitt Romney answered in part

“I am not a scientist myself, but my best assessment of the data is that the world is getting warmer, that human activity contributes to that warming, and that policymakers should therefore consider the risk of negative consequences. However, there remains a lack of scientific consensus on the issue— on the extent of the warming, the extent of the human contribution, and the severity of the risk — and I believe we must support continued debate and investigation within the scientific community….

Economic growth and technological innovation, not economy-suppressing regulation, is the key to environmental protection in the long run. So I believe we should pursue what I call a “No Regrets” policy — steps that will lead to lower emissions, but that will benefit America regardless of whether the risks of global warming materialize and regardless of whether other nations take effective action. “

Mitt Romney clearly understands that the climate system is much more complicated than oversimplified by President Obama.

In my post in December 2011

Comment On The National Journal Article  “Heads In The Sand” By Coral Davenport – Its Not Just The Republicans But The Democrats Also

I commented on the viewpoints of the two political parties, which I summarized in the abstract [highlight added]

Many Republicans do not accept the current understanding of climate science. Democrats, however,  also have their “heads in the sand” with respect to the reality of the human role in the climate system. This polarization also illustrate how politicized climate science has become.

The three hypotheses of the human role in the climate system can be, with only a few exceptions, be summarized in terms of the political party.

1. the Republican Party view – Human influence on climate variability and change is of minimal importance, and natural causes dominate climate variations and changes on all time scales. In coming decades, the human influence will continue to be minimal

climate change  >> human caused effects including emissions of CO2 and a few other greenhouse

2. the Democratic Party View – Although the natural causes of climate variations and changes are undoubtedly important, the human influences are significant and are dominated by the emissions into the atmosphere of greenhouse gases, the most important of which is CO2. The adverse impact of these gases on regional and global climate constitutes the primary climate issue for the coming decades

climate change = global warming = human emissions of CO2 and a few other greenhouse

3. the Real World View – Although the natural causes of climate variations and changes are undoubtedly important, the human influences are significant and involve a diverse range of first-order climate forcings, including, but not limited to, the human input of carbon dioxide (CO2). Most, if not all, of these human influences on regional and global climate will continue to be of concern during the coming decades –

climate change >>  global warming  > human caused effects > emissions of CO2 and a few other greenhouse

In order to develop a more robust discussion of climate science, there are two science questions, as a start, that I recommend be asked of members of both political parties

1. Is global warming (and cooling) a subset of climate change or does it dominate climate change?

2. What evidence exists that the multi-decadal global climate models can skillfully predict i) the real-world observed behaviour of large-scale atmospheric-ocean circulation features such as ENSO, the NAO, the PDO, ect. and ii) CHANGES in the statistics (patterning and in time) of these circulation features?

I recommended a Way-Forward

In our article

Pielke Sr., R., K.  Beven, G. Brasseur, J. Calvert, M. Chahine, R. Dickerson, D.  Entekhabi, E. Foufoula-Georgiou, H. Gupta, V. Gupta, W. Krajewski, E.  Philip Krider, W. K.M. Lau, J. McDonnell,  W. Rossow,  J. Schaake, J.  Smith, S. Sorooshian,  and E. Wood, 2009: Climate change: The need to consider human forcings besides greenhouse gases.   Eos, Vol. 90, No. 45, 10 November 2009, 413. Copyright (2009) American   Geophysical Union. https://pielkeclimatesci.files.wordpress.com/2009/12/r-354.pdf

our abstract reads

“We discuss the adoption of a bottom-up, resource–based vulnerability approach in evaluating the effect of climate and other environmental and societal threats to societally critical resources. This vulnerability concept requires the determination of the major threats to local and regional water, food, energy, human health, and ecosystem function resources from extreme events including climate, but also from other social and environmental issues. After these threats are identified for each resource, then the relative risks can be compared with other risks in order to adopt optimal preferred mitigation/adaptation strategies.

This is a more inclusive way of assessing risks, including from climate variability and climate change than using the outcome vulnerability approach adopted by the IPCC. A contextual vulnerability assessment, using the bottom-up, resource-based framework is a more inclusive approach for policymakers to adopt effective mitigation and adaptation methodologies to deal with the complexity of the spectrum of social and environmental extreme events that will occur in the coming decades, as the range of threats are assessed, beyond just the focus on CO2 and a few other greenhouse gases as emphasized in the IPCC assessments.”

Among the questions policymakers should ask include:

  • What is the sensitivity of this resource to changes in each of these key variables? (This may include but is not limited to, the sensitivity of the resource to climate variations and change on short (days); medium (seasons) and long (multi-decadal) time scales).
  • What changes (thresholds) in these key variables would have to occur to result in a negative (or positive) outcome for this resource?

In his answer, President Obama perpetuates the erroneously narrow view advocated by the Democratic Party. In contrast, Mitt Romney has moved from the different, but still mistaken perspective of climate science by the Republican Party to one that is in agreement with my viewpoint on our understanding of the climate system and the way to move forward to deal with climate issues. Using my terminology above, Mitt Romney has the Real World View of the climate issue.

If Mitt Romney’s perspective on other issues is as well-thought out as his views on climate, he is clearly the more qualified of the two candidates to be President. 

Comments Off on My Comment On “The Top American Science Questions: 2012” On “Climate Change”

Filed under Climate Science Reporting, Q & A on Climate Science

A Provocative New Study Reported By The BBC – Arctic Ice Melt ‘Like Adding 20 Years Of CO2 Emissions'”

source of image

There is a provocative new study reported by Susan Watts of the BCC. It is titled [highlight added]

Arctic ice melt ‘like adding 20 years of CO2 emissions’

and includes the text

The loss of Arctic ice is massively compounding the effects of greenhouse gas emissions, ice scientist Professor Peter Wadhams has told BBC Newsnight.

Prof Wadhams calculates this absorption of the sun’s rays is having an effect “the equivalent of about 20 years of additional CO2 being added by man”.

“Over that 1% of the Earth’s surface you are replacing a bright surface which reflects nearly all of the radiation falling on it with a dark surface which absorbs nearly all.

“The difference, the extra radiation that’s absorbed is, from our calculations, the equivalent of about 20 years of additional CO2 being added by man,” Prof Wadhams said.

If his calculations are correct then that means that over recent decades the melting of the Arctic ice cap has put as much heat into the system as all the CO2 we have generated in that time.

However, what Peter Wadhams did not report is that IF, as a result of a reduction of surface albedo, the reduction in the Arctic ice cap has put as much heat into the system as all the CO2 we have generated in that time, it means that the radiative warming contribution of added CO2 over recent decades, as diagnosed by upper surface heat content, a global average surface temperature anomaly, a lower tropospheric temperature anomaly, etc, has been significantly overstated.

It is certainly plausible that the radiative effect of added CO2 has contributed to the melting of the Arctic sea ice, but its contribution to global average warming is less than  reported by the IPCC.

Rather than “massively compounding the effects of greenhouse gas emissions” as Peter Wadhams states, if he is correct on the effect of the albedo reduction due to loss of sea ice on the global average radiative forcing, he has reduced the importance of added CO2 as a global average radiative forcing as diagnosed from observations and from models, and reported in the 2007 IPCC report.

With respect to the magnitude of Arctic warming, colleagues of  mine and I are in the process of completing a paper in which this will be a component. From the analysis of NCEP reanalysis lower tropospheric temperatures (completed by Emily Gill of the University of Colorado at Boulder), the June, July and August warming since 1979 has been +1.0 C, and since 1998 +0.5 to +0.6 C in the region from 60N and from 70N to the pole.  Whether this warming can explain the Arctic sea ice melting needs further exploration but it seems relatively small as a response to both added CO2 and/or the reduced albedo.  We will have more details on this paper when ready.

Comments Off on A Provocative New Study Reported By The BBC – Arctic Ice Melt ‘Like Adding 20 Years Of CO2 Emissions'”

Filed under Climate Change Forcings & Feedbacks, Climate Science Reporting

A Comment On The Nature Article – “Time To Raft Up- Climate Scientists Should Learn From The Naysayers And Pull Together To Get Their Message Across, Says Chris Rapley”

There is an interesting Nature article which was published this week

Rapley Chris, 2012: Climate science: Time to raft up.  Nature. 488, 583-585 doi:10.1038/488583a

with the subtitle

Climate scientists should learn from the naysayers and pull together to get their message across, says Chris Rapley.

In this Nature Comment, Chris Rapley makes a serious fundamental error, in my view.  He writes that

“….the voices of dismissal are trumping the messages of science.”

However, in my view, that is not the correct way to frame the problem. One reason that there has been little progress in effective climate policy is that the message on climate science that is presented to the public and policymakers is incorrectly too narrow. Climate issues, as influenced by human activities, are much more than a global average surface temperature anomaly threshold.

The issue of whether limits should be sought on atmospheric concentrations of CO2 is not all there is to the role of humans in the climate system, nor should climate mitigation and adaptation risks not consider the variations and longer term trends in the natural climate system. As Dan Sarewitz and my son said with respect to risks from adding too much CO2 into the atmosphere “We know enough!” on the threat from added CO2.

My son’s book

The Climate Fix by Roger A. Pielke Jr.

makes this case convincingly.

However, the added CO2, as important as it is, is but a part of what humans are doing to the climate.

The need for this broader viewpoint has been emphasized in international and national assessments;

Kabat, P., Claussen, M., Dirmeyer, P.A., J.H.C. Gash, L. Bravo de Guenni, M. Meybeck, R.A. Pielke Sr., C.J. Vorosmarty, R.W.A. Hutjes,             and S. Lutkemeier, Editors, 2004: Vegetation, water, humans and the climate: A new perspective on an interactive system. Springer, Berlin, Global Change – The IGBP Series, 566 pp.

National Research Council, 2005: Radiative forcing of climate change: Expanding the concept and addressing uncertainties. Committee on Radiative Forcing Effects on Climate Change, Climate Research Committee, Board on Atmospheric Sciences and Climate, Division on Earth and Life Studies, The National Academies Press, Washington, D.C., 208 pp.

but the leadership of the climate science community who are communicating with policymakers and the public are ignoring these assessments.

This was the reason we wrote our paper [of which all of the authors are AGU Fellows]

Pielke Sr., R., K.  Beven, G. Brasseur, J. Calvert, M. Chahine, R. Dickerson, D.  Entekhabi, E. Foufoula-Georgiou, H. Gupta, V. Gupta, W. Krajewski, E.  Philip Krider, W. K.M. Lau, J. McDonnell,  W. Rossow,  J. Schaake, J.  Smith, S. Sorooshian,  and E. Wood, 2009: Climate change: The need to consider human forcings besides greenhouse gases.   Eos, Vol. 90, No. 45, 10 November 2009, 413. Copyright (2009) American   Geophysical Union.

As just two examples, first in my post from yesterday

Follow Up On The AMS Statement On “Climate Change’

after a set of e-mail exchanges, Danny Rosenfeld agreed that

1. On a regional scale, the aerosols can be the dominant anthropogenic climate forcing.

2. On a global scale, the aerosols might be in par with the GHG. We just don’t know

In our paper,

Pielke Sr., R.A., A. Pitman, D. Niyogi, R. Mahmood, C. McAlpine, F. Hossain, K. Goldewijk, U. Nair, R. Betts, S. Fall, M. Reichstein, P. Kabat, and N. de Noblet-Ducoudré, 2011: Land  use/land cover changes and climate: Modeling analysis  and  observational evidence. WIREs Clim Change 2011, 2:828–850. doi: 10.1002/wcc.144

the abstract reads

This article summarizes the changes in landscape structure because of human land management over the last several centuries, and using observed and modeled data, documents how these changes have altered biogeophysical and biogeochemical surface fluxes on the local, mesoscale, and regional scales. Remaining research issues are presented including whether these landscape changes alter large-scale atmospheric circulation patterns far from where the land use and land cover changes occur. We conclude that existing climate assessments have not yet adequately factored in this climate forcing. We conclude that existing climate assessments have not yet adequately factored in this climate forcing. For those regions that have undergone intensive human landscape change, or would undergo intensive change in the future, we conclude that the failure to factor in this forcing risks a misalignment of investment in climate mitigation and adaptation.

The public is more perceptive of reality than is often realized. It is the neglect of proper consideration of the actual diversity of climate science issues that, I feel, explains at least part of what Chris reported in the Nature article as

A recent UK survey found that about one-third of the public agrees with the statement “We can trust climate scientists to tell us the truth about climate change” and that about one-third disagrees.

As a way forward, we have proposed a different approach that is in summarized in our paper

Pielke Sr., R.A., R. Wilby, D. Niyogi, F. Hossain, K. Dairuku, J. Adegoke, G. Kallos, T. Seastedt, and K. Suding, 2012: Dealing  with complexity and extreme events using a bottom-up, resource-based  vulnerability perspective. AGU Monograph on Complexity and  Extreme Events in Geosciences, in press.

where our abstract reads

We discuss the adoption of a bottom-up, resource–based vulnerability approach in evaluating the effect of climate and other environmental and societal threats to societally critical resources. This vulnerability concept requires the determination of the major threats to local and regional water, food, energy, human health, and ecosystem function resources from extreme events including climate, but also from other social and environmental issues. After these threats are identified for each resource, then the relative risks can be compared with other risks in order to adopt optimal preferred mitigation/adaptation strategies.

This is a more inclusive way of assessing risks, including from climate variability and climate change than using the outcome vulnerability approach adopted by the IPCC. A contextual vulnerability assessment, using the bottom-up, resource-based framework is a more inclusive approach for policymakers to adopt effective mitigation and adaptation methodologies to deal with the complexity of the spectrum of social and environmental extreme events that will occur in the coming decades, as the range of threats are assessed, beyond just the focus on CO2 and a few other greenhouse gases as emphasized in the IPCC assessments.

The adoption of the bott0m-up, contextual vulnerability approach fits better with the concept of the “honest broker” as discussed in my son’s book

The Honest Broker: Making Sense of Science in Policy and Politics by Roger A. Pielke Jr.

than does the current climate science leadership’s excessively narrow top-down, outcome vulnerability approach. In my view, the “naysayers” include this leadership, as exemplified by the new AMS Statement on Climate Change.  I recommend rewriting what Chris Rapley writes to

Climate scientists should include the diversity of perspectives on the role of humans and natural processes and pull together to get this broader message across.

Then, perhaps, by using the bottom-up, contextual vulnerability approach, we can then finally make progress not only on the CO2 issue, but also on all of the other aspects of risks from the climate system.

source of image

Comments Off on A Comment On The Nature Article – “Time To Raft Up- Climate Scientists Should Learn From The Naysayers And Pull Together To Get Their Message Across, Says Chris Rapley”

Filed under Climate Science Op-Eds, Climate Science Reporting

“Changing The Climate Change Debate” – A Message From A News Article From 2001 That Is Just As Needed in 2012

On February 19 2001, the Fort Collins Coloradoan posted the following article

“Changing the climate change debate”

by Kevin Darst. The article had the subtitle

“CSU researchers want to look at factors other than greenhouse gases”

In over 10 years, unfortunately, the “leadership” that is completing climate assessments, such as for the IPCC reports, has learned little about the behavior of the real climate system.

I have reproduced the entire article below except for the picture of me with the caption

“Taking a different view: Colorado State University atmospheric science professor Roger Pielke wants to see additional factors such as land use included with greenhouse gas emissions in climate change research.

Tom Stohlgren’s quote

“It’s difficult to describe a complex system, and there’s no more complex system than the earth”.

is highlighted in a box.

The article itself reads

If forecasters can’t predict the weather more than five days out, how can scientists predict it a century from now.

That’s what Roger Pielke wants to know.

“The bottom line is that climate is an integrated earth system problem,” said Pielke, the state climatologist and a Colorado State University professor. “You can’t predict it past next season.”

Pielke, who was in San francisco Sunday for the American Association for the Advancement of Science meeting, is concerned too much stock is put in long-term predictions based solely on increased carbon dioxide levels.  Those assessments from the Intergovernmental Panel on the Climate Convention and the United States National Assessment, predict sharp rises in temperature by 2100.

But land-use trends should also be figured in the model, Pielke said. A U.S. Geological Survey study Pielke contributed to suggested irrigation along the Front Range prompted cooler, wetter summers for Rocky Mountain National Park by putting  more water vapor in the air.

“You can’t explain weather or climate by one factor,” Pielke said. Weather prediction is very difficult. Seasonal predictions are more difficult. It should be no surprise that predicting 50 years from now is hard.”

Still, people eat up such predictions without examining the shortfalls, said Tom Stohlgren, an ecologist for the U.S. Geological Survey and a CSU professor.

“All the caveats get left out”,  Stohlgren said. “as a public, we’re satisfied with a quick and easy answer.

“It’s difficult to describe a complex system, and there’s no more complex system than the earth.”

Climate predictions, however, shouldn’t be considered as absolute truth, said Dennis Ojima, the senior scientist at CSU’s Natural Ecology Laboratory.

“They’re looking more or less at the physical interactions of the climate system and the various scenarios….involved with greenhouse gas warming,” said Ojima who also serves as the Great Plains coordinator for the National Climate Change Assessment.  “It’s part of the tool kit.”

Instead of focusing on predictions, scientists should focus on a region’s vulnerabilities, Stohlgren and Pielke said.  For Colorado, that means the chance of epic droughts. It can also mean positives such a longer growing seasons for farmers and less crop damage from frost.

Ojima agreed.

Doing a little bit of both is prudent,” he said of predictions and vulnerability studies.

In the meantime, the uncertainty of man’s impact on the earth worries Stohlgren.

“We’re putting a lot of greenhouse gases into the atmosphere,” Stohlgren said. “We’re not sure what the long term effects are.”

But as technology advances, all three are confident those advances could help scientists better understand the intricate relationships between climate factors.

This article could be just rereported in 2012.

Comments Off on “Changing The Climate Change Debate” – A Message From A News Article From 2001 That Is Just As Needed in 2012

Filed under Climate Science Reporting

Update On The Indian Monsoon By Madhav Khandekar

The following is an update that Madhav has sent us. For context, see the post

Guest Post “June 18, 2012 – A Commentary On 2012 Monsoon progress over India By Madhav Khandekar

” Are man-made factors behind erratic Monsoon? ( The Hindu, August 12 2012)

A recent article from the Hindu ( a well-read English daily in India) discusses if the erratic behaviour of this year’s monsoon is due to “man-made” factors (increased CO2, aerosols etc) and whether such factors may adversely impact monsoon behaviour in future. This year’s monsoon has been erratic in its progress since early june, but this is not unusual! Rarely ever, monsoon season progresses ‘smoothly’ with evenly distributed rainfall everywhere! This year’s monsoon was projected by most climate models to be a deficient monsoon and it now appears that this year’s monsoon will go down as another deficit monsoon like in 2009, 2004 and 2002.

However, this year’s monsoon has also produced some heavy rainfalls and extensive flooding! Early in June there was extensive flooding in the northeast, then in southeast and since the last three weeks, there have been heavy rains and localized flooding in parts of central India! In some locales rainfall amounts of 100mm or more per day have occurred in parts of central India. Also western and northwestern parts of India have received some decent rains in last ten days or so. The  monsoon report from the India Met Department for the week 8-15 August 2012  shows cumulative rainfall since June.

Yes, it is true that overall the large-scale monsoon circulation patterns have weakened in the last fifty years, contrary to most climate models’ projection of a ‘more vigorous’ monsoon in a warming world! Why has the large-scale monsoon weakened in the last fifty years is a ‘mystery’ and there is a definite need to investigate this aspect further. Are aerosols ( identified as ABC-Asian Brown Cloud) impacting monsoon adversely? Indian monsoon circulation patterns are primarily governed by large-scale atmosphere-ocean patterns ( the ENSO phase, the IOD-Indian Ocean Dipole in the equatorial Indian Ocean,  the equatorial stratospheric QBO- Quasi-Biennial Oscillation, the Eurasian winter snow accumulation, etc) and are NOT impacted by aerosols or the recent warming of the earth’s climate at this point in time.

Seasonal prediction of monsoon is still fraught with several uncertainties and most climate models have achieved only a limited success in simulating or predicting monsoon rainfall on a seasonal time-scale.  A simple operational model (see my ppt talk at Heartland Institute’s Conference in May 2012) can often provide a useful guidance for seasonal prediction of monsoon rainfall over India and vicinity.

Comments Off on Update On The Indian Monsoon By Madhav Khandekar

Filed under Climate Science Reporting