Monthly Archives: July 2012

Summary Of Two Game-Changing Papers – Watts Et al 2012 and McNider Et Al 2012

UPDATE #2: To make sure everyone clearly recognizes my involvement with both papers, I provided Anthony suggested text and references for his article [I am not a co-author of the Watts et al paper], and am a co-author on the McNider et al paper.

UPDATE: There has been discussion as to whether the Time of Observation Bias (TOB) could affect the conclusions reached in Watts et al (2012). This is a valid concern.  Thus the “Game Changing” finding of whether the trends are actually different for well- and poorly-sited locations is  tenative until it is shown whether or not TOB alters the conclusions.  The issue, however, is not easy to resolve. In our paper

Pielke Sr., R.A., T. Stohlgren, L. Schell, W. Parton, N. Doesken, K. Redmond, J. Moeny, T. McKee, and T.G.F. Kittel, 2002: Problems in evaluating regional and local trends in temperature: An example from eastern Colorado, USA. Int. J. Climatol., 22, 421-434.

this is what we concluded [highlight added]

The time of observation biases clearly are a problem in using raw data from the US Cooperative stations. Six stations used in this study have had documented changes in times of observation. Some stations, like Holly, have had numerous changes. Some of the largest impacts on monthly and seasonal temperature time series anywhere in the country are found in the Central Great Plains as a result of relatively frequent dramatic interdiurnal temperature changes. Time of observation adjustments are therefore essential prior to comparing long-term trends.

We attempted to apply the time of observation adjustments using the paper by Karl et al. (1986). The actual implementation of this procedure is very difficult, so, after several discussions with NCDC personnel familiar with the procedure, we chose instead to use the USHCN database to extract the time of observation adjustments applied by NCDC. We explored the time of observation bias and the impact on our results by taking the USHCN adjusted temperature data for 3 month seasons, and subtracted the seasonal means computed from the station data adjusted for all except time of observation changes in order to determine the magnitude of that adjustment. An example is shown here for Holly, Colorado (Figure 1), which had more changes than any other site used in the study.

What you would expect to see is a series of step function changes associated with known dates of time of observation changes. However, what you actually see is a combination of step changes and other variability, the causes of which are not all obvious. It appeared to us that editing procedures and procedures for estimating values for missing months resulted in computed monthly temperatures in the USHCN differing from what a user would compute for that same station from averaging the raw data from the Summary of the Day Cooperative Data Set. This simply points out that when manipulating and attempting to homogenize large data sets, changes can be made in an effort to improve the quality of the data set that may or may not actually accomplish the initial goal.

Overall, the impact of applying time of observation adjustment at Holly was to cool the data for the 1926–58 with respect to earlier and later periods. The magnitude of this adjustment of 2 °C is obviously very large, but it is consistent with changing from predominantly late afternoon observation times early in the record to early morning observation times in recent years in the part of the country where time of observation has the greatest effect. Time of observation adjustments were also applied at five other sites.

Until this issue is resolved, the Game Changer aspect of the Watts et al 2012 study  is tenative. [Anthony reports he is actively working to resolve this issue on hold ] The best way to address the TOB issue is to use data from sites in the Watts et al data set that have hourly resolution.  For those years, when the station is unchanging in location, compute the TOB.  The Karl et al (1986) method of TOB adjustment, in my view, needs to be more clearly defined and further examined  in order to better address this issue. I understand research is underway to examine the TOB issue in detail, and results will be reported by Anthony when ready.

*************ORIGINAL POST****************

There are two recent papers that raise serious questions on the accuracy of the quantitative  diagnosis of global warming by NCDC, GISS, CRU and BEST based on land surface temperature anomalies.   These papers are a culmination of two areas of uncertainty study that were identified in the paper

Pielke Sr., R.A., C. Davey, D. Niyogi, S. Fall, J. Steinweg-Woods, K. Hubbard, X. Lin, M. Cai, Y.-K. Lim, H. Li, J. Nielsen-Gammon, K. Gallo, R. Hale, R. Mahmood, S. Foster, R.T. McNider, and P. Blanken, 2007: Unresolved issues with   the assessment of multi-decadal global land surface temperature trends. J. Geophys. Res., 112, D24S08, doi:10.1029/2006JD008229.

The Summary

  • One paper [Watts et al 2012] show that siting quality does matter. A warm bias results in the continental USA when poorly sited locations are used to construct a gridded analysis of land surface temperature anomalies.
  • The other paper [McNider et al 2012] shows that not only does the height at which minimum temperature observations are made matter, but even slight changes in vertical mixing (such as from adding a small shed near the observation site, even in an otherwise pristine location) can increase the measured temperature at the height of the observation. This can occur when there is little or no layer averaged warming.

The Two Papers

Watts et al, 2012: An area and distance weighted analysis of the impacts of station exposure on the U.S. Historical Climatology Network temperatures and temperature trends [to be submitted to JGR]

McNider, R. T., G.J. Steeneveld, B. Holtslag, R. Pielke Sr, S. Mackaro, A. Pour Biazar, J. T. Walters, U. S. Nair, and J. R. Christy (2012). Response and sensitivity of the nocturnal boundary layer over land to added longwave radiative forcing, J. Geophys. Res.,doi:10.1029/2012JD017578, in press. [for the complete paper, click here]

To Provide Context

First, however, to make sure that my perspective on climate is properly understood;

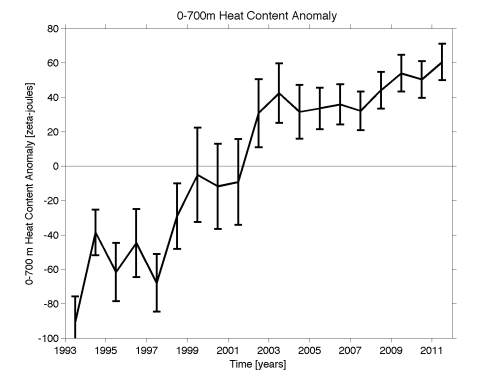
i) There has been global warming over the last several decades. The ocean is the component of the climate system that is best suited for quantifying climate system heat change [Pielke, 2003] e.g. see the figure below from NOAA’s Upper Ocean Heat Content Anomaly for their estimate of the magnitude of warming since 1993

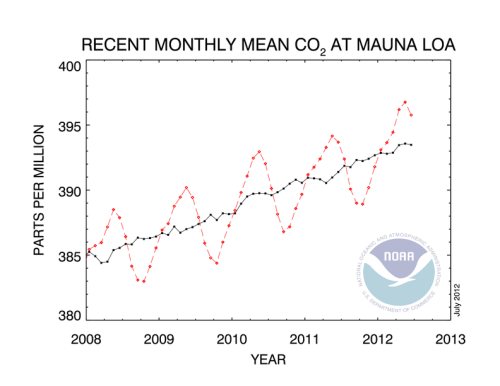
ii) The human addition to CO2 into the atmosphere is a first-order climate forcing; e.g. see Pielke et al (2009) and the NOAA plot below

However, the Watts et al 2012 and McNider et al 2012 papers  refute a major assumption in the CCSP 1.1 report

Temperature Trends in the Lower Atmosphere – Understanding and Reconciling Differences

that variations in surface temperature anomalies are random and this can be averaged to create area means that are robust measures of the average surface temperature in that region (and when summed globally, provide an accurate global land average surface temperature anomaly).  Randomness, and with assumption of no systematic biases, is shown in the two papers to be incorrect.

In the chapter

Lanzante et al 2005: What do observations indicate about the changes of temperatures in the atmosphere and at the surface since the advent of measuring temperatures vertically?

they write that [highlight added]

“Currently, there are three main groups creating global analyses of surface temperature (see Table 3.1), differing in the choice of available data that are utilized as well as the manner in which these data are synthesized.

My Comment: Now there is the addition of Richard Muller’s BEST analysis.

Since the network of surface stations changes over time, it is necessary to assess how well the available observations monitor global or regional temperature. There are three ways in which to make such assessments (Jones, 1995). The first is using “frozen grids” where analysis using only those grid boxes with data present in the sparsest years is used to compare to the full data set results from other years (e.g., Parker et al., 1994). The results generally indicate very small errors on multi-annual timescales (Jones, 1995). “

My Comment:  The “frozen grids” combine data from poor- and well-site locations, and from different heights.  A warm bias results. This is a similar type of analysis as used in BEST.

The second technique is sub-sampling a spatially complete field, such as model output, only where in situ observations are available. Again the errors are small (e.g., the standard errors are less than 0.06ºC for the observing period 1880 to 1990; Peterson et al., 1998b).

My Comment:  Again, there is the assumption that no systematic biases exist in the observations. Poorly sited locations are blended with well-sited locations which, based on Watts et al (2012), artificially elevates the sub-sampled trends.

The third technique is comparing optimum averaging, which fills in the spatial field using covariance matrices, eigenfunctions or structure functions, with other analyses. Again, very small differences are found (Smith et al., 2005). The fidelity of the surface temperature record is further supported by work such as Peterson et al. (1999) which found that a rural subset of global land stations had almost the same global trend as the full network and Parker (2004) that found no signs of urban warming over the period covered by this report.

My Comment:  Here is where the assumption that the set of temperature anomalies are random is presented. Watts et al (2012) provide observational evidence, and McNider et al (2012)  present theoretical reasons, why this is an incorrect assumption.

Since the three chosen data sets utilize many of the same raw observations, there is a degree of interdependence. Nevertheless, there are some differences among them as to which observing sites are utilized. An important advantage of surface data is the fact that at any given time there are thousands of thermometers in use that contribute to a global or other large-scale average. Besides the tendency to cancel random errors, the large number of stations also greatly facilitates temporal homogenization since a given station may have several “near-neighbors” for “buddy-checks.” While there are fundamental differences in the methodology used to create the surface data sets, the differing techniques with the same data produce almost the same results (Vose et al., 2005a).

My Comment: There statement that there is “the tendency to cancel random errors” is shown in the Watts et al 2012 and McNider et al 2012 papers to be incorrect. This means their claim that  “the large number of stations also greatly facilitates temporal homogenization since a given station may have several “near-neighbors” for “buddy-checks.”  is erroneously averaging together sites with a warm bias.

Bottom Line Conclusion: The Watts et al 2012 and McNider et al 2012 papers have presented the climate community with evidence of major systematic warm biases in the analysis of multi-decadal land surface temperature anomalies by NCDC, GISS, CRU and BEST.  The two paper also help explain the discrepancy seen between the multi-decadal temperature trends in the surface and lower tropospheric temperature that was documented in

Klotzbach, P.J., R.A. Pielke Sr., R.A. Pielke Jr.,  J.R. Christy, and R.T. McNider, 2009: An alternative explanation for differential temperature trends at the  surface and in the lower troposphere. J. Geophys. Res., 114, D21102, doi:10.1029/2009JD011841.

Klotzbach, P.J., R.A. Pielke Sr., R.A. Pielke Jr.,  J.R. Christy, and R.T. McNider, 2010: Correction to: “An alternative explanation for differential temperature trends at the  surface and in the lower troposphere. J. Geophys. Res., 114, D21102, doi:10.1029/2009JD011841″, J. Geophys. Res.,  115, D1, doi:10.1029/2009JD013655.

I look forward to discussing the conclusions of these two studies in the coming weeks and months.

source of image

Comments Off on Summary Of Two Game-Changing Papers – Watts Et al 2012 and McNider Et Al 2012

Filed under Climate Change Metrics, RA Pielke Sr. Position Statements, Research Papers

Comments On The Game Changer New Paper “An Area And Distance Weighted Analysis Of The Impacts Of Station Exposure On The U.S. Historical Climatology Network Temperatures And Temperature Trends” By Watts Et Al 2012

Congratulations to Anthony Watts! Today, Anthony  has announced his seminal new paper

An area and distance weighted analysis of the impacts of station exposure on the U.S. Historical Climatology Network temperatures and temperature trends

in his post

PRESS RELEASE

This paper is a game changer, in my view, with respect to the use of the land surface temperature anomalies as part of the diagnosis of global warming. 

The new study extends and improves on the study of station siting quality, as they affect multi-decadal surface air temperature trends, that was introduced in

Fall, S., A. Watts, J. Nielsen-Gammon, E. Jones, D. Niyogi, J. Christy, and R.A. Pielke Sr., 2011: Analysis of the impacts of station exposure on the U.S. Historical Climatology Network temperatures and temperature trends. J. Geophys. Res., 116, D14120, doi:10.1029/2010JD015146.Copyright (2011) American Geophysical Union.

and whose results have been used by others; i.e.

Martinez, C.J., Maleski, J.J., Miller, M.F, 2012: Trends in precipitation and temperature in Florida, USA. Journal of Hydrology. volume 452-453, issue , year 2012, pp. 259 – 281

Anthony has led what is a critically important assessment of the issue of station quality. Indeed, this type of analysis should have been performed by Tom Karl and Tom Peterson at NCDC, Jim Hansen at GISS and Phil Jones at the University of East Anglia (and Richard Muller).  However, they apparently liked their answers and did not want to test the robustness of their findings.

In direct contradiction to Richard Muller’s BEST study,  the new Watts et al 2012 paper has very effectively shown that a substantive warm bias exists even in the mean temperature trends.  This type of bias certainly exists throughout the Global Historical Climate Network, as well as what Anthony has documented for the US Historical Climate Reference Network.

Despite what is written on the NCDC website for the USHCN website; i.e. that

The U.S. Historical Climatology Network (USHCN, Karl et al. 1990) is a high-quality moderate sized data set of monthly averaged maximum, minimum, and mean temperature and total monthly precipitation developed to assist in the detection of regional climate change.

the USHCN is not yet a robust set of quality controlled data.

Anthony’s new results also undermine the latest claims by Richard Muller of BEST, as not only is Muller extracting data from mostly the same geographic areas as for the NCDC, GISS and CRU analyses, but he is accepting an older  assessment of station siting quality as it affects the trends.

Indeed, since he accepted the Fall et al 2011 study in reporting his latest findings, he now needs to retrench and re-compute his trends. Of course, for the non-USHCN sites, he must bin those sites as performed by Anthony’s research group. If he does not, his study should be relegated to a footnote of a out-of-date analysis.

In Richard Muller’s Op-Ed in the New York Times (see The Conversion of a Climate-Change Skeptic), he makes far-reaching conclusions based on his sparse knowledge of the uncertainties in multi-decadal land surface temperature record. His comments show what occurs when a scientist, with excellent research credentials within their area of scientific expertise, go outside of their area of knowledge.

His latest BEST claims are, in my view, an embarrassment. The statement that he makes in his op-ed that [highlight added]

My total turnaround, in such a short time, is the result of careful and objective analysis by the Berkeley Earth Surface Temperature project, which I founded with my daughter Elizabeth. Our results show that the average temperature of the earth’s land has risen by two and a half degrees Fahrenheit over the past 250 years, including an increase of one and a half degrees over the most recent 50 years. Moreover, it appears likely that essentially all of this increase results from the human emission of greenhouse gases.

is easily refuted. See, for example,

National Research Council, 2005: Radiative forcing of climate change: Expanding the concept and addressing uncertainties. Committee on Radiative Forcing Effects on Climate Change, Climate Research Committee, Board on Atmospheric Sciences and Climate, Division on Earth and Life Studies, The National Academies Press, Washington, D.C., 208 pp.

Pielke Sr., R., K.  Beven, G. Brasseur, J. Calvert, M. Chahine, R. Dickerson, D.  Entekhabi, E. Foufoula-Georgiou, H. Gupta, V. Gupta, W. Krajewski, E.  Philip Krider, W. K.M. Lau, J. McDonnell,  W. Rossow,  J. Schaake, J.  Smith, S. Sorooshian,  and E. Wood, 2009: Climate change: The need to consider human forcings besides greenhouse gases.   Eos, Vol. 90, No. 45, 10 November 2009, 413. Copyright (2009) American   Geophysical Union.

Pielke Sr., R.A., A. Pitman, D. Niyogi, R. Mahmood, C. McAlpine, F. Hossain, K. Goldewijk, U. Nair, R. Betts, S. Fall, M. Reichstein, P. Kabat, and N. de Noblet-Ducoudré, 2011: Land  use/land cover changes and climate: Modeling analysis  and  observational evidence. WIREs Clim Change 2011, 2:828–850. doi: 10.1002/wcc.144.

A. J. Pitman, F. B. Avila, G. Abramowitz, Y. P.Wang, S. J. Phipps and N. de Noblet-Ducoudré, 2011: Importance of background climate in determining impact of land-cover change on regional climate. Nature Climate Change.: 20 November 2011 | DOI: 10.1038/NCLIMATE1294

Avila, F. B., A. J. Pitman, M. G. Donat, L. V. Alexander, and G. Abramowitz (2012), Climate model simulated changes in temperature extremes due to land cover change, J. Geophys. Res., 117, D04108, doi:10.1029/2011JD016382

Now, with the new Watts et al 2012 paper, Richard Muller’s conclusion regarding the robustness of the BEST analysis is refuted in the same day as his op-ed appeared.

Richard Muller, in his latest analysis, continues to ignore past communications regarding the robustness of his results; e. g. see

Informative News Article by Margot Roosevelt In The Los Angeles Times On Richard Muller’s Testimony To Congress

Is There A Sampling Bias In The BEST Analysis Reported By Richard Muller?

Comments On The Testimony Of Richard Muller At the United States House Of Representatives Committee On Science, Space And Technology

Richard Muller On NPR On April 11 2011 – My Comments

It certainly appears that Richard Muller is an attention-getter, which he has succeeded at, but, unfortunately, he has demonstrated a remarkable lack of knowledge concerning the uncertainties in quantifying the actual long-term surface temperature trend, as well as a seriously incomplete knowledge of the climate system.

The proper way to complete a research study is provided in the Watts et al 2012 article.  This article, a culmination of outstanding volunteer support under Anthony’s leadership, shows that Anthony Watts clearly understands the research process in climate science. As a result of his, and of and his colleagues, rigorous dedication to the scientific method, he has led a much more robust study than performed by Richard Muller in the BEST project.

Finally, on Andy Revkin’s well-respected and influential weblog Dot Earth,  in a comment with respect to his post

‘Converted’ Skeptic: Humans Driving Recent Warming

he writes

Muller’s database will hold up as a powerful added tool for assessing land-side climate patterns, but his confidence level on the human element in recent climate change will not. I’d be happy to be proved wrong, mind you.

Andy’s assumption that “Muller’s database will hold up as a powerful added tool for assessing land-side climate patterns” is now shown as incorrect.

The new Watts et al 2012 paper shows that Muller’s data base is really not a significant new addition for assessing land-side climate patterns, at least until further analyses are performed on the siting quality of the stations he uses in the BEST assessment.

Anthony Watt’s new paper shows that  a major correction is needed Muller’s BEST study.  Anthony also has shown what dedicated scientists can do with even limited financial support.  Despite the large quantities of funds spent on the BEST study, it is Anthony Watts and his team who have actually significantly advanced our understanding of  this aspect of the climate system.  Well done Anthony!

source of image

Comments Off on Comments On The Game Changer New Paper “An Area And Distance Weighted Analysis Of The Impacts Of Station Exposure On The U.S. Historical Climatology Network Temperatures And Temperature Trends” By Watts Et Al 2012

Filed under Climate Change Metrics, Research Papers

New Paper “Trends In Precipitation And Temperature In Florida, USA” By Martinez Et Al 2012

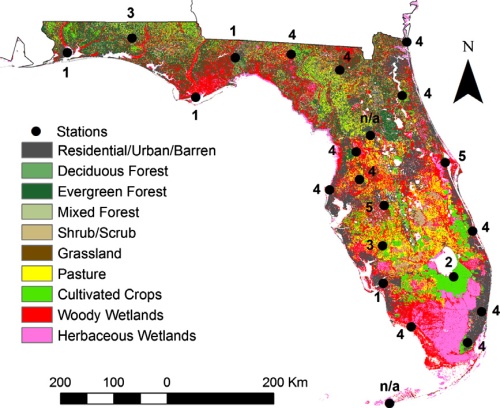
source of image: Martinez et al 2012

There is an excellent new paper on temperature and precipitation trends over multi-decadal time periods. The article is

Martinez, C.J., Maleski, J.J., Miller, M.F, 2012: Trends in precipitation and temperature in Florida, USA. Journal of Hydrology. volume 452-453, issue , year 2012, pp. 259 – 281

The abstract reads [highlight added]

Annual, seasonal, and monthly trends in precipitation, mean temperature, maximum temperature, minimum temperature, and temperature range were evaluated using stations from the United States Historical Climatology Network (USHCN) for the time periods 1895–2009 and 1970–2009 for the state of Florida. The significance and magnitude of station trends were determined using the non-parametric Mann–Kendall test and Sen’s slope, respectively. The collective, field significance of trends were evaluated using a Monte Carlo permutation procedure. Field significant trends in seasonal precipitation were found in only the June–August and March–May seasons for the 1895–2009 and 1970–2009 time periods, respectively. Significant decreasing trends in monthly precipitation were found in the months of October and May for the 1895–2009 and 1970–2009 time periods, respectively. Field significant trends were found for all temperature variables for both time periods, with the largest number of stations with significant trends occurring in the summer and autumn months. Trends in mean, maximum, and minimum temperature were generally positive with a higher proportion of positive trends in the 1970–2009 period. The spatial coherence of trends in temperature range was generally less compared to other temperature variables, with a larger proportion of stations showing negative trends in the summer and positive trends at other times of the year and more negative trends found in the 1970–2009 period. Significant differences in temperature trends based on the surrounding land use were found for minimum temperature and temperature range in the 1970–2009 period indicating that data homogenization of the USHCN temperature data did not fully remove this influence. The evaluation of trends based on station exposure ratings shows significant differences in temperature variables in both the 1895–2009 and 1970–2009 time periods. Systematic changes in trends can be seen in the 1980s, the period of widespread conversion from liquid-in-glass to electronic measurement, indicating that some of the differences found may be due to uncorrected inhomogeneities. Since notable differences were found between differently rated stations pre-1940, a time which the present-day rating should have little to no influence, attribution of differences based on station rating should be done with caution.

The Highlights listed by the author are

► Significant trends were found in precipitation, temperature and temperature range.

► More statistically significant trends were found for temperature than rainfall.

► Station exposure may influence temperature trends.

Among the conclusions is the finding that

Significant differences in most temperature variables were found between good and poorly sited stations based on the classification of USHCN stations using the USCRN rating system.

This study illustrates the need for detailed assessment of the reason for observed temperature and precipitation trends as influenced by station siting and by land use type in their vicinity. This type of study is what NCDC should be doing, but they have left it to others, such as

Marshall, C.H. Jr., R.A. Pielke Sr., L.T. Steyaert, and D.A. Willard,  2004: The impact of anthropogenic land-cover change on the Florida peninsula  sea breezes and warm season sensible weather. Mon. Wea. Rev., 132, 28-52.

and

Fall, S., A. Watts, J. Nielsen-Gammon, E. Jones, D. Niyogi, J. Christy, and R.A. Pielke Sr., 2011: Analysis of the impacts of station exposure on the U.S. Historical Climatology Network temperatures and temperature trends. J. Geophys. Res.,  116, D14120, doi:10.1029/2010JD015146.Copyright (2011) American Geophysical Union

whom Martinez et al 2012 cite.

As they conclude  in their paper

This work provides a preliminary analysis of historical trends in the climate record in the state of Florida. While this work did not attempt to fully attribute the cause of observed trends, it provides a first step in future attribution to possible causes including multidecadal climate variability, long term regional temperature trends, and potential errors caused by station siting, regional land use/land cover, and data homogenization.

We need more such detailed analyses, in order to further examine the multitude of issues with the USHCN and GHCN analyses of long term temperature and precipitation trends. Despite what is written on the NCDC website for the USHCN website; i.e. that

The U.S. Historical Climatology Network (USHCN, Karl et al. 1990) is a high-quality moderate sized data set of monthly averaged maximum, minimum, and mean temperature and total monthly precipitation developed to assist in the detection of regional climate change.

they are really not as of as high a quality as claimed.

Comments Off on New Paper “Trends In Precipitation And Temperature In Florida, USA” By Martinez Et Al 2012

Filed under Climate Change Metrics, Research Papers

News Report “NASA: Sudden Massive Melt in Greenland” – My Comments On This Media Hype

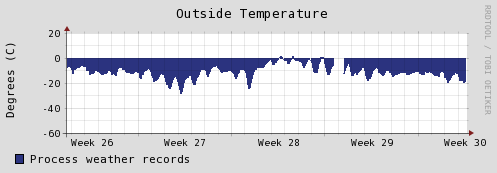
source of image: Greenland Summit Station – the plot is of temperatures at the top of the Greenland icecap for the last 30 days.

The current webcam image from this location can be viewed here.

There is a news report by Seth Borenstein titled

NASA: Sudden Massive Melt in Greenland

which reads in part [headline added]

Nearly all of Greenland’s massive ice sheet suddenly started melting a bit this month, a freak event that surprised scientists.

The ice melt area went from 40 percent of the ice sheet to 97 percent in four days, according to NASA. Until now, the most extensive melt seen by satellites in the past three decades was about 55 percent.

Wagner said researchers don’t know how much of Greenland’s ice melted, but it seems to be freezing again.

Summer in Greenland has been freakishly warm so far. That’s because of frequent high pressure systems that have parked over the island, bringing warm clear weather that melts ice and snow, explained University of Georgia climatologist Thomas Mote.

He and others say it’s similar to the high pressure systems that have parked over the American Midwest bringing record-breaking warmth and drought’

The news headline, in particular, is an example of media hype. There was no “massive melt“. The term “massive” implies that the melt involved large masses of the Greenland icecap. They could have written Sudden Extensive, Short-Term Surface Melting On the Greenland Icecap“, but instead chose to overstate what is a short-term weather event. Melting of surface ice occurs in Greenland whenever there are relatively warm surface air temperatures, as shown in the plot from Summit Station at the top of this post, and sunny skies, as reported by Thomas Mote in Seth’s article.  Almost anytime, sublimation (direct transfer from ice to water vapor) occurs.

There has been widespread media reporting of this melting (e.g. Fox News, MSNBC), but the real news story is the overstatement of this weather event by the media (and some scientists at NASA).  The headline is the biased part of the article, which Seth may not have much control on, but, regardless, this biased misleading headline needs to be identified.

Comments Off on News Report “NASA: Sudden Massive Melt in Greenland” – My Comments On This Media Hype

Filed under Bias In News Media Reports

Comments On The Cato Report “ADDENDUM: Global Climate Change Impacts In The United States” By Michaels Et Al 2012

I have been alerted to an informative, much-needed detailed 2012 Cato Institute asssessment of the 2009 US government report “Global Climate Change Impacts in the United States. See also Judy Curry’s excellent post on the Cato report at

Cato’s Impact Assessment

The web page that links to this 2009 US government  report starts with the grandiose claims that [highlight added]

This web page will introduce and lead you through the content of the most comprehensive and authoritative report of its kind. The report summarizes the science and the impacts of climate change on the United States, now and in the future.

and

In addition to discussing the impacts of climate change in the U.S., the report also highlights the choices we face in response to human-induced climate change. It is clear that impacts in the United States are already occurring and are projected to increase in the future, particularly if the concentration of heat-trapping greenhouse gases in the atmosphere continues to rise. So, choices about how we manage greenhouse gas emissions will have far-reaching consequences for climate change impacts. Similarly, there are choices to be made about adaptation strategies that can help to reduce or avoid some of the undesirable impacts of climate change. This report provides many of the scientific underpinnings for effective decisions to be made – at the national and at the regional level.

The new report, to be published by Cato this fall, is titled

“ADDENDUM:Global Climate Change Impacts in the United States”

with Patrick J. Michaels as Editor-in-Chief. I have been fortunate to know and respect Pat since we meet at the University of Virginia during my tenure there in the 1970s and early 1980s.  This Cato report is a very important new addition to providing policymakers with a more robust perspective of  climate science. It is refreshing to see a much more objective assessment than prepared by Tom Karl and others in the federal government.

As written in the draft cover letter by Edward H. Crane, President of the Cato Institute,

The Center for the Study of Public Science and Public Policy at the Cato Institute is pleased to transmit to you a major revision of the report, “Global Climate Change Impacts in the United States”. The original document served as the principal source of information regarding the climate of the US for the Environmental Protection Agency’s December 7, 2009 Endangerment Finding from carbon dioxide and other greenhouse gases. This new document is titled “ADDENDUM: Global Climate Change Impacts in the United States”

This effort grew out of the recognition that the original document was sorely lacking in relevant scientific detail. A Cato review of a draft noted that it was among the worst summary documents on climate change ever written, and that literally every paragraph was missing critical information from the refereed scientific literature. While that review was extensive, the restricted timeframe for commentary necessarily limited any effort. The following document completes that effort.

The introduction of the report states that

This report summarizes the science that is missing from Global Climate Change Impacts in the United States, a 2009 document produced by the U.S. Global Change Research Program (USGCRP) that was critical to the Environmental Protection Agency’s December, 2009 “finding of endangerment” from increasing atmospheric carbon dioxide and other greenhouse gases. According to the 2007 Supreme Court decision, Massachusetts v. EPA, the EPA must regulate carbon dioxide under the 1990 Clean Air Act Amendments subsequent to finding that it endangers human health and welfare. Presumably this means that the Agency must then regulate carbon dioxide to the point at which it longer causes “endangerment”.

The conclusion of the Cato report reads

Climate change assessments such as the one produced by the USGCRP suffer from a systematic bias due to the fact that the experts involved in making the assessment have economic incentives to paint climate change as a dire problem requiring their services, and the services of their university, federal laboratory, or agency.

I have just a few comments and recommendations for the final Cato report.

1. The 2005 National Research Council report

National Research Council, 2005: Radiative forcing of climate change: Expanding the concept and addressing uncertainties.             Committee on Radiative Forcing Effects on Climate Change, Climate Research Committee, Board on Atmospheric Sciences and Climate, Division on Earth and Life Studies, The National Academies Press, Washington, D.C., 208 pp

should be discussed. The  2009 US government report “Global Climate Change Impacts in the United States focuses on greenhouse gases at the expense of other human climate forcings. The findings in the 2005 NRC report were ignored.  The need to broaden out the consideration of non-greenhouse gas climate forcings is summarized in the article by AGU Fellows in

Pielke Sr., R., K.  Beven, G. Brasseur, J. Calvert, M. Chahine, R. Dickerson, D.  Entekhabi, E. Foufoula-Georgiou, H. Gupta, V. Gupta, W. Krajewski, E.  Philip Krider, W. K.M. Lau, J. McDonnell,  W. Rossow,  J. Schaake, J.  Smith, S. Sorooshian,  and E. Wood, 2009: Climate change: The need to consider human forcings besides greenhouse gases.   Eos, Vol. 90, No. 45, 10 November 2009, 413. Copyright (2009) American   Geophysical Union.

I testified to a congressional subcommittee on the need for a broader view in

Pielke Sr., Roger A., 2008: A Broader View of the Role of Humans in the Climate System is Required In the   Assessment of Costs and Benefits of Effective Climate Policy. Written Testimony for the Subcommittee on Energy and   Air Quality of the Committee on Energy and Commerce Hearing “Climate Change:   Costs of Inaction” – Honorable Rick Boucher, Chairman. June 26, 2008, Washington, DC., 52 pp.

A major finding is the global warming is just a subset of “climate change”.  Climate also always has involved change, with or without the human influence. See my discussion on these subjects in my post

The Need For Precise Definitions In Climate Science – The Misuse Of The Terminology “Climate Change”

and in Shaun Lovejoy’s paper that I posted on in

Excellent New Paper “The Climate Is Not What You Expect” By Lovejoy and Schertzer 2012

2. The failure of the climate models to show any decadal and longer regional predictive skill should be highlighted. I recently summarized this failure in the post

CMIP5 Climate Model Runs – A Scientifically Flawed Approach

and in our articles

Pielke Sr., R.A., and R.L. Wilby, 2012: Regional climate downscaling – what’s the point? Eos Forum,  93, No. 5, 52-53, doi:10.1029/2012EO050008.

Pielke Sr., R.A., R. Wilby, D. Niyogi, F. Hossain, K. Dairuku, J. Adegoke, G. Kallos, T. Seastedt, and K. Suding, 2012: Dealing  with complexity and extreme events using a bottom-up, resource-based  vulnerability perspective. AGU Monograph on Complexity and  Extreme Events in Geosciences, in press.

3. The role of land use change as a climate forcing should be discussed in detail. Examples of papers with this perspective include

Pielke Sr., R.A., A. Pitman, D. Niyogi, R. Mahmood, C. McAlpine, F. Hossain, K. Goldewijk, U. Nair, R. Betts, S. Fall, M. Reichstein, P. Kabat, and N. de Noblet-Ducoudré, 2011: Land  use/land cover changes and climate: Modeling analysis  and  observational evidence. WIREs Clim Change 2011, 2:828–850. doi: 10.1002/wcc.144.

Avila, F. B., A. J. Pitman, M. G. Donat, L. V. Alexander, and G. Abramowitz (2012), Climate model simulated changes in temperature extremes due to land cover change, J. Geophys. Res., 117, D04108, doi:10.1029/2011JD016382

4. The very significant problems with the land surface temperature data sets, as used to diagnose global warming, should be presented in detail in the report. Papers that document this issue include

Pielke Sr., R.A., C. Davey, D. Niyogi, S. Fall, J. Steinweg-Woods, K. Hubbard, X. Lin, M. Cai, Y.-K. Lim, H. Li, J. Nielsen-Gammon, K. Gallo, R. Hale, R. Mahmood, S. Foster, R.T. McNider, and P. Blanken, 2007: Unresolved issues with   the assessment of multi-decadal global land surface temperature trends. J. Geophys. Res., 112, D24S08, doi:10.1029/2006JD008229.

Klotzbach, P.J., R.A. Pielke Sr., R.A. Pielke Jr.,  J.R. Christy, and R.T. McNider, 2009: An alternative explanation for differential temperature trends at the  surface and in the lower troposphere. J. Geophys. Res., 114, D21102, doi:10.1029/2009JD011841.

Klotzbach, P.J., R.A. Pielke Sr., R.A. Pielke Jr.,  J.R. Christy, and R.T. McNider, 2010: Correction to: “An alternative explanation for differential temperature trends at the  surface and in the lower troposphere. J. Geophys. Res., 114, D21102, doi:10.1029/2009JD011841″, J. Geophys. Res.,  115, D1, doi:10.1029/2009JD013655.

Fall, S., A. Watts, J. Nielsen-Gammon, E. Jones, D. Niyogi, J. Christy, and R.A. Pielke Sr., 2011: Analysis of the impacts of station exposure on the U.S. Historical Climatology Network temperatures and temperature trends. J. Geophys. Res.,  116, D14120, doi:10.1029/2010JD015146.Copyright (2011) American Geophysical Union.

McNider, R.T., G.J. Steeneveld, B. Holtslag, R. Pielke Sr, S.   Mackaro, A. Pour Biazar, J.T. Walters, U.S. Nair, and J.R. Christy, 2012: Response and sensitivity of the nocturnal boundary layer over  land to added longwave radiative forcing. J. Geophys. Res., doi:10.1029/2012JD017578, in press.

5. My experience with the arrogance of the writers of one of the earlier reports used to generate the  2009 report “Global Climate Change Impacts in the United States have been documented in

Pielke Sr., Roger A., 2005: Public Comment on CCSP Report “Temperature Trends in the Lower Atmosphere: Steps for Understanding and Reconciling Differences“. 88 pp including appendices.

and in

My Comments For The InterAcademy Council Review of the IPCC

Comments Off on Comments On The Cato Report “ADDENDUM: Global Climate Change Impacts In The United States” By Michaels Et Al 2012

Filed under Climate Science Reporting, Research Papers

The 2012 Norwegian Climate Research Report – Reinforcing The Need To Broaden Climate Science Assessments

I was alerted to a report [h/t Robert Pollock] titled

Norwegian climate research – an evaluation

In Section 2.1.1.6 (Future Directions), as Robert altered us to, there is this interesting text [highlight added]

Although the expressed political needs regarding science results primarily relate to the impact of anthropogenic greenhouse gasses, there is also a need for increased research on the impact of human activity on land cover and land-use change, especially in relation to the albedo and the biogeochemical and hydrological cycles. Furthermore, a good understanding of the climate system cannot be reached without a dedicated effort to understand the contribution to climate change from natural climate processes. The geological history very clearly documents a strong climate forcing associated with solar variability, although the exact mechanism has not been identified. This should call for a coherent international effort, but surprisingly, the worldwide scientific effort to increase our understanding of the natural variations is very limited, and this is most probably related to the limited funding available for basic, not agenda-driven research. Therefore, in addition to implementing the recommendations of Klima21, this committee recommends an increased effort in research on the natural causes of climate change, in particular the activity variations of the sun, the mechanism of cloud formation, and the multi-decadal variations in ocean current systems.

This is a remarkable recognition by an internationally well-respected group of climate scientists that there is a need to move beyond the inappropriately narrow focus of the IPCC on the global annual average radiative forcing from CO2 and a few other greenhouse gases. The Norwegian report reinforces the conclusion reached in the USA report

National Research Council, 2005: Radiative forcing of climate change: Expanding the concept and addressing uncertainties.             Committee on Radiative Forcing Effects on Climate Change, Climate Research Committee, Board on Atmospheric Sciences and Climate, Division on Earth and Life Studies, The National Academies Press, Washington, D.C., 208 pp

where the Executive Summary includes the finding that

Despite all these advantages, the traditional global mean TOA radiative forcing concept has some important limitations, which have come increasingly to light over the past decade. The concept is inadequate for some forcing agents, such as absorbing aerosols and land-use changes, that may have regional climate impacts much greater than would be predicted from TOA radiative forcing. Also, it diagnoses only one measure of climate change—global mean surface temperature response—while offering little information on regional climate change or precipitation. These limitations can be addressed by expanding the radiative forcing concept and through the introduction of additional forcing metrics. In particular, the concept needs to be extended to account for (1) the vertical structure of radiative forcing, (2) regional variability in radiative forcing, and (3) nonradiative forcing. A new metric to account for the vertical structure of radiative forcing is recommended below. Understanding of regional and nonradiative forcings is too premature to recommend specific metrics at this time. Instead, the committee identifies specific research needs to improve quantification and understanding of these forcings.

source of image

Comments Off on The 2012 Norwegian Climate Research Report – Reinforcing The Need To Broaden Climate Science Assessments

Filed under Climate Science Reporting

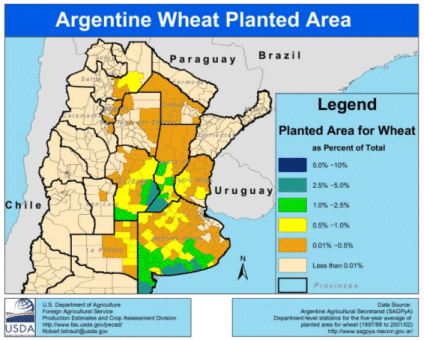
Another Example Of Weather Risks Due To Atmospheric Circulation Patterns “Argentine Wheat Sowing Slowed By Cold, Dry Weather”

As the USA drought and heat continues to significantly affect crops, I came across an interesting news article on a weather threat in South America that is due to cold and dry weather. The article Hugh Bronstein of Reuters is titled

Argentine wheat sowing slowed by cold, dry weather

Excerpts read [highlight added]

CBOT wheat prices rise for four straight weeks

* Adverse global crop weather fans supply worries

* Argentine growers shy from wheat to avoid export curbs

“BUENOS AIRES, July 13 (Reuters) – Dry, cold weather slowed Argentine wheat planting last week as farmers struggled to penetrate their frost-covered fields, the government said on Friday, further complicating a season marked by low output expectations. Argentina is the world’s No. 6 wheat exporter and principal supplier to neighboring Brazil. But plantings are set to fall 17 percent versus the previous crop year to 3.82 million hectares.”

The lack of rain over the last seven days was aggravated by low temperatures and frost throughout Buenos Aires province,” the Agriculture Ministry said in its weekly crop report. Buenos Aires accounts for more than half of Argentina’s total wheat output. In the district of Bragado, in the northern part of the province, “frosts have delayed the advance in the planting of winter wheat,” the report said. Chicago Board of Trade wheat prices have risen for four straight weeks, up 38.1 percent in that period, as adverse crop weather in major producers such as the United States and Australia fans supply worries. “

“Argentina, the world No. 3 soybean exporter, suffered a six-week drought in the December-January dog days of the Southern Hemisphere summer. The heat wave struck just as 2011/12 soy and corn plants were in their most delicate stage of flowering. The dry spell melted original expectations of a bumper crop and heavy May rains swamped some fields in Buenos Aires province, bogging down harvesting combines and forcing farmers to leave their late-seeded soy to rot.”

“….heat and drought continued to eat away at U.S. crop prospects. Argentina is also the world’s No. 2 corn exporter and the government estimates this season’s production at 20.1 million tonnes after the drought dashed early expectations of a 2011/12 crop well over the 23 million tonnes harvested in 2010/11.”

In terms of risks from weather extremes, the current threat to crops further illustrate that a global average surface temperature anomaly is not a useful metric to assess risk. Agriculture has always been at risk from weather extremes and this threat will continue into the future regardless of whether or not there are alteration in local and regional climate from human and/or natural forcings and feedbacks. A prudent way to reduce risk is to first develop mitigation and adaptation policies to weather extremes we have already experienced, and then build in a buffer in case more extreme events actually occur in the coming decades.

As the Reuters news article wrote

But the United Nations expects global food demand to double by 2050 as world population hits 9 billion. Argentina, which boasts a fertile Pampas grains belt bigger than the size of France, will be key to feeding an increasingly hungry world.

which means risk would increase even in the absence of changes in local and regional climate statistics.

source of image

Comments Off on Another Example Of Weather Risks Due To Atmospheric Circulation Patterns “Argentine Wheat Sowing Slowed By Cold, Dry Weather”

Filed under Climate Science Reporting, Vulnerability Paradigm

CMIP5 Climate Model Runs – A Scientifically Flawed Approach

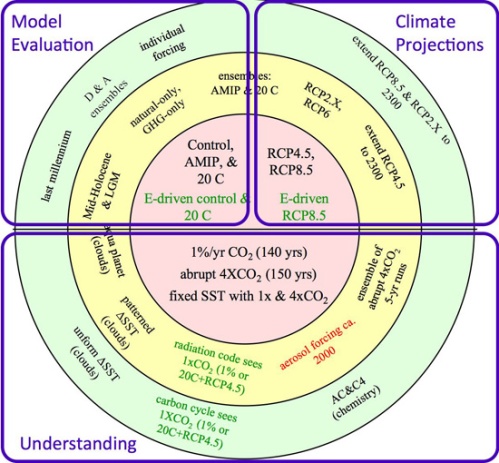
CMIP5 Climate model predictions for the coming decades is an integral part of the upcoming IPCC assessment.  The CMIP5 – Coupled Model Intercomparison Project Phase 5 is intended to

“to promote a new set of coordinated climate model experiments. These experiments  comprise the fifth phase of the Coupled Model Intercomparison Project (CMIP5).  CMIP5 will notably provide a multi-model context for 1) assessing the mechanisms  responsible for model differences in poorly understood feedbacks associated with  the carbon cycle and with clouds, 2) examining climate “predictability” and  exploring the ability of models to predict climate on decadal time scales, and,  more generally, 3) determining why similarly forced models produce a range of  responses.”

They report that

CMIP5 promotes a standard set of model simulations in order to:

  • evaluate how realistic the models are in simulating the recent past,
  • provide projections of future climate change on two time scales, near term (out to about 2035) and long term (out to 2100 and beyond), and
  • understand some of the factors responsible for differences in model projections, including quantifying some key feedbacks such as those involving clouds and the carbon cycle

My post today is to summarize the lack of scientific value in those model predictions with respect to “evaluate how realistic the models are in simulating the recent past” and, thus their  use to project (predict) “future climate change on two time scales, near term (out to about 2035) and long term (out to 2100 and beyond.” My post brings together information from several recent posts.

The first requirement of the CMIP5 runs, before they should even be spending time and money on projections,  is that they must skillfully (and shown with quantitative analyses) to

  •  replicate the statistics of the current climate,

and

  • replicate the changes in climate statistics over this time period.

However, peer-reviewed studies that have quantitatively examined this issue using hindcast runs show large problems even with respect to current model statistics, much less their change over time. 

Examples of these studies include

1. Fyfe, J. C., W. J. Merryfield, V. Kharin, G. J. Boer, W.-S. Lee, and K. von Salzen (2011), Skillful predictions of decadal trends in global mean surface temperature, Geophys. Res. Lett.,38, L22801, doi:10.1029/2011GL049508

who concluded that

”….for longer term decadal hindcasts a linear trend correction may be required if the model does not reproduce long-term trends. For this reason, we correct for systematic long-term trend biases.”

2. Xu, Zhongfeng and Zong-Liang Yang, 2012: An improved dynamical downscaling method with GCM bias corrections and its validation with 30 years of climate simulations. Journal of Climate 2012 doi: http://dx.doi.org/10.1175/JCLI-D-12-00005.1

who find that without tuning from real world observations, the model predictions are in significant error. For example, they found that

”…the traditional dynamic downscaling (TDD) [i.e. without tuning) overestimates precipitation by 0.5-1.5 mm d-1…..The 2-year return level of summer daily maximum temperature simulated by the TDD is underestimated by 2-6°C over the central United States-Canada region.”

3. van Oldenborgh, G.J., F.J. Doblas-Reyes, B. Wouters, W. Hazeleger (2012): Decadal prediction skill in a multi-model ensemble. Clim.Dyn. doi:10.1007/s00382-012-1313-4

who report quite limited predictive skill in two regions of the oceans on the decadal time period, but no regional skill elsewhere, when they conclude that

“A 4-model 12-member ensemble of 10-yr hindcasts has been analysed for skill in SST, 2m temperature and precipitation. The main source of skill in temperature is the trend, which is primarily forced by greenhouse gases and aerosols. This trend contributes almost everywhere to the skill. Variation in the global mean temperature around the trend do not have any skill beyond the first year. However, regionally there appears to be skill beyond the trend in the two areas of well-known low-frequency variability: SST in parts of the North Atlantic and Pacific Oceans is predicted better than persistence. A comparison with the CMIP3 ensemble shows that the skill in the northern North Atlantic and eastern Pacific is most likely due to the initialisation, whereas the skill in the subtropical North Atlantic and western North Pacific are probably due to the forcing.”

4. Anagnostopoulos, G. G., Koutsoyiannis, D., Christofides, A., Efstratiadis, A. & Mamassis, N. (2010) A comparison of local and aggregated climate model outputs with observed data. Hydrol. Sci. J. 55(7), 1094–1110

who report that

“…. local projections do not correlate well with observed measurements. Furthermore, we found that the correlation at a large spatial scale, i.e. the contiguous USA, is worse than at the local scale.”

5. Stephens, G. L., T. L’Ecuyer, R. Forbes, A. Gettlemen, J.‐C. Golaz, A. Bodas‐Salcedo, K. Suzuki, P. Gabriel, and J. Haynes (2010), Dreary state of precipitation in global models, J. Geophys. Res., 115, D24211, doi:10.1029/2010JD014532.

who wrote

“models produce precipitation approximately twice as often as that observed and make rainfall far too lightly…..The differences in the character of model precipitation are systemic and have a number of important implications for modeling the coupled Earth system …….little skill in precipitation [is] calculated at individual grid points, and thus applications involving downscaling of grid point precipitation to yet even finer‐scale resolution has little foundation and relevance to the real Earth system.”

6. Sun, Z., J. Liu, X. Zeng, and H. Liang (2012), Parameterization of instantaneous global horizontal irradiance at the surface. Part II: Cloudy-sky component, J. Geophys. Res., doi:10.1029/2012JD017557, in press.

who report that

“Radiation calculations in global numerical weather prediction (NWP) and climate models are usually performed in 3-hourly time intervals in order to reduce the computational cost. This treatment can lead to an incorrect Global Horizontal Irradiance (GHI) at the Earth’s surface, which could be one of the error sources in modelled convection and precipitation. …… An important application of the scheme is in global climate models. The radiation sampling error due to infrequent radiation calculations is investigated using the this scheme and ARM observations. It is found that these errors are very large, exceeding 800 W m-2 at many non-radiation time steps due to ignoring the effects of clouds….”

7. Ronald van Haren, Geert Jan van Oldenborgh, Geert Lenderink, Matthew Collins and Wilco Hazeleger, 2012: SST and circulation trend biases cause an underestimation of European precipitation trends Climate Dynamics 2012, DOI: 10.1007/s00382-012-1401-5

who report that

“To conclude, modeled atmospheric circulation and SST trends over the past century are significantly different from the observed ones. These mismatches are responsible for a large part of the misrepresentation of precipitation trends in climate models. The causes of the large trends in atmospheric circulation and summer SST are not known.”

Even the most basic of climate model predictions that global average water vapor is increasing (and thus would amplify the radiative warming from added CO2) is in question; see

Vonder Haar, T. H., J. Bytheway, and J. M. Forsythe (2012), Weather and climate analyses using improved global water vapor observations, Geophys. Res. Lett.,doi:10.1029/2012GL052094, in press.

There is an important summary of the limitations in multi-decadal regional climate predictions in

Kundzewicz, Z. W., and E.Z. Stakhiv (2010) Are climate models “ready for prime time” in water resources managementapplications, or is more research needed? Editorial. Hydrol. Sci. J. 55(7), 1085–1089.

who conclude that

“Simply put, the current suite of climate models were not developed to provide the level of accuracy required for adaptation-type analysis.”

These studies, and I am certain more will follow, show that the multi-decadal climate models are not even skillfully simulating current climate statistics, as are needed by the impacts communities, much less CHANGES in climate statistics.  At some point, this waste of money to make regional climate predictions decades from now is going to be widely recognized.

source of image

Comments Off on CMIP5 Climate Model Runs – A Scientifically Flawed Approach

Filed under Climate Science Misconceptions, Research Papers

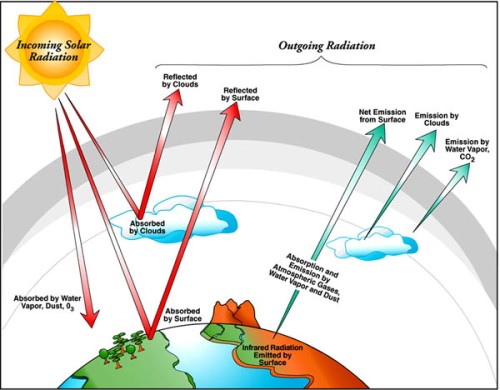
New Paper “Parameterization Of Instantaneous Global Horizontal Irradiance At The Surface. Part II: Cloudy-Sky Component” By Sun Et Al 2012

There is yet another paper that documents the lack of skill in multi-decadal global climate models to skillfully predict climate conditions in the coming years. This paper involves the question of accuracy lost when radiation parameterizations are used at time intervals that are long compared to other physical processes in the models.  The paper is

Sun, Z., J. Liu, X. Zeng, and H. Liang  (2012), Parameterization of instantaneous global horizontal irradiance at the surface. Part II:  Cloudy-sky componentJ. Geophys. Res., doi:10.1029/2012JD017557, in press. [the full paper is not yet available   the full paper is available at the  JGR site by clicking PIP PDF – h/t Victor Venema]

The abstract reads [highlight added]

Radiation calculaions in global numerical weather prediction (NWP) and climate models are usually performed in 3-hourly time intervals in order to reduce the computational cost. This treatment can lead to an incorrect Global Horizontal Irradiance (GHI) at the Earth’s surface, which could be one of the error sources in modelled convection and precipitation. In order to improve the simulation of the diurnal cycle of GHI at the surface a fast scheme has been developed in this study and it can be used to determine the GHI at the Earth’s surface more frequently with affordable costs. The scheme is divided into components for clear-sky and cloudy-sky conditions. The clear-sky component has been described in part I. The cloudy-sky component is introduced in this paper. The scheme has been tested using observations obtained from three Atmospheric Radiation Measurements (ARM) stations established by the U. S. Department of Energy. The results show that a half hourly mean relative error of GHI under all-sky conditions is less than 7%. An important application of the scheme is in global climate models. The radiation sampling error due to infrequent radiation calculations is investigated using the this scheme and ARM observations. It is found that these errors are very large, exceeding 800 W m-2 at many non-radiation time steps due to ignoring the effects of clouds. Use of the current scheme can reduce these errors to less than 50 W m-2.

These errors are clearly larger than the few W m-2 that are due to human climate forcings, and even large relative to the natural variations of radiative fluxes.  This is yet another example of why the IPCC models are not robust tools to predict changes in global, regional and local climate statistics.

source of image

Comments Off on New Paper “Parameterization Of Instantaneous Global Horizontal Irradiance At The Surface. Part II: Cloudy-Sky Component” By Sun Et Al 2012

Filed under Climate Models, Research Papers

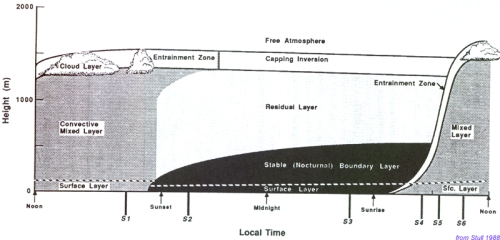
Further Confirmation Of The Misinterpretation Of Miniumum Land Surface Temperature Trends By NCDC, CRU, GISS And BEST As Part Of A Diagnostic Of Global Warming

In post

Guest Post By Richard McNider On The New JGR – Atmosphere Article “Response And Sensitivity Of The Nocturnal Boundary Layer Over Land To Added Longwave Radiative Forcing”

Dick McNider reported in our new paper

McNider, R.T., G.J. Steeneveld, B. Holtslag, R. Pielke Sr, S.   Mackaro, A. Pour Biazar, J.T. Walters, U.S. Nair, and J.R. Christy, 2012: Response and sensitivity of the nocturnal boundary layer over   land to added longwave radiative forcing. J. Geophys. Res., doi:10.1029/2012JD017578, in press.

on a likely warm bias in multi-decadal trends of minimum land temperatures when they are used as part of the diagnosis of global warming.

Anthony Watts had an excellent follow-up in his post

Important New Paper on the Nocturnal Boundary Layer, Mixing, and Radiative Forcing as it applies to GHCN weather stations

In our earlier paper

Klotzbach, P.J., R.A. Pielke Sr., R.A. Pielke Jr.,  J.R. Christy, and R.T. McNider, 2009: An alternative explanation for differential temperature trends at the  surface and in the lower troposphere. J. Geophys. Res., 114, D21102, doi:10.1029/2009JD011841.

we wrote that [highlight added]

“…the minimum temperature occurs in the shallow, cool nocturnal boundary layer (NBL). The NBL is a delicate, nonlinear dynamical system that may be disrupted by increases in surface roughness, surface heat fluxes or radiative forcing. Under strong cooling and light winds, the surface becomes decoupled from the warm air above. A small change in any of these may then trigger coupling, or the downward mixing of warmer air which significantly raises minimum temperature readings. This disruption need occur only a few extra times per year to generate a warmer minimum temperature trend over time. In fact nighttime temperatures are more about the state of turbulence in the atmosphere than the temperature in the deep atmosphere. As an example, the minimum temperature will be quite different based on factors that influence turbulence, such as roughness or wind speed even if the temperature of the deep atmosphere aloft is the same [McNider et al., 1995; Shi et al., 2005]. Candidates for increasing these decoupling events are buildings (roughness), surface heat capacity changes such as irrigated deserts or pavement (heat flux), increased water vapor and increased aerosols (radiative forcing). All of these decoupling events have been observed [Pielke et al., 2007a, 2007b; Christy et al., 2009]. Increases in greenhouse gases can also cause a disruption of the nocturnal boundary layer as enhanced downward radiation destabilizes the NBL allowing more warm air from aloft to be mixed to the surface [Walters et al., 2007]. However, any upward trends in nighttime temperatures [from the above effects] are due to this redistribution of heat and should not be interpreted as an increased accumulation of heat [Walters et al., 2007].

Because the land surface temperature record does in fact combine temperature minimum and maximum temperature measurements, where there has been a reduction in nighttime cooling due to this disruption, the long-term temperature record will have a warm bias. The warm bias will represent an increase in measured temperature because of a local redistribution of heat, however it will not represent an increase in the accumulation of heat in the deep atmosphere. The reduction in nighttime cooling that leads to this bias may indeed be the result of human interference in the climate system (i.e., local effects of increasing greenhouse gases, surface conditions, aerosols or human effects on cloud cover), but through a causal mechanism distinct from the large-scale radiative effects of greenhouse gases. Local land use surface changes in which the local surface roughness and local heat release are altered [see also de Laat, 2008] will also result in a warming bias at night if the local vertical temperature lapse rate is made less stable over time.

The warm bias in the temperature data would most likely be in evidence over land areas where larger vertical temperature stratification occurs near the ground along with a reduction of the atmospheric cooling rate. This effect will be largest in the higher latitudes, especially in minimum temperatures during the winter months, since any reduction in the cooling rate of the atmosphere will result in a particularly large temperature increase near the ground surface in this strongly stably stratified boundary layer.

The new McNider et al 2012 paper, documents in detail why an increase of minimum temperature over time can occur due to changes in vertical turbulent mixing of heat, even without any change in temperatures elsewhere in the troposphere.

In terms of global warming, as reported before on this weblog; see

Significance And Correction Of Misinterpretation By The Media Of The Zhou Et Al 2012 Paper “Impacts Wind Farms On Land Surface Temperature

where we wrote

The global average surface temperature anomalies are computed by the formula

ΔT (global average) = ΔT(ocean average) times fraction of the globe covered by ocean + ΔT (land average) times the fraction of the globe covered by land (including regions with ice sheets).

The value of ΔT (land average) is computed by

ΔT (land average) = ∑ Δ [Tmax + Tmin]/2

where Δ [Tmax + Tmin]/2 is the mean temperature anomaly, such as used in the BEST study, and by NCDC, CRU and GISS;  focused on 2m above the surface ……”

ΔTmin =  ΔTmin (a spatially representative temperature trend from “global warming” or “global cooling”) + ΔTmin (a local change due to changes in vertical mixing in the lowest levels of the atmosphere) + ΔTmin (due to other local effects usch as station siting – Fall et al 2011; see also Pielke st al 2007).

It is important to note that ΔTmin (a local change due to changes in vertical mixing in the lowest levels of the atmosphere) can occur even in pristine locations due to changes in long wave cooling at night (from alterations in cloudiness, water vapor and/or CO2).

In terms of an order of estimate of this bias  (e.g. see Klotzbach et al 2012a), it is on the order of a tenths of a degree Celcius per decade warm bias in the land analyses reported by in the NCDC, GISS, CRU and BEST data.

In other words, the magnitude of multi-decadal land temperature trends, as a diagnostic of global warming, as reported by NCDC, GISS, CRU and BEST for the last several decades is significantly overstatedThis organizations are miscommunicating the complete explanation for observed surface temperature trends over land.

source of image

Comments Off on Further Confirmation Of The Misinterpretation Of Miniumum Land Surface Temperature Trends By NCDC, CRU, GISS And BEST As Part Of A Diagnostic Of Global Warming

Filed under Climate Change Metrics, Research Papers